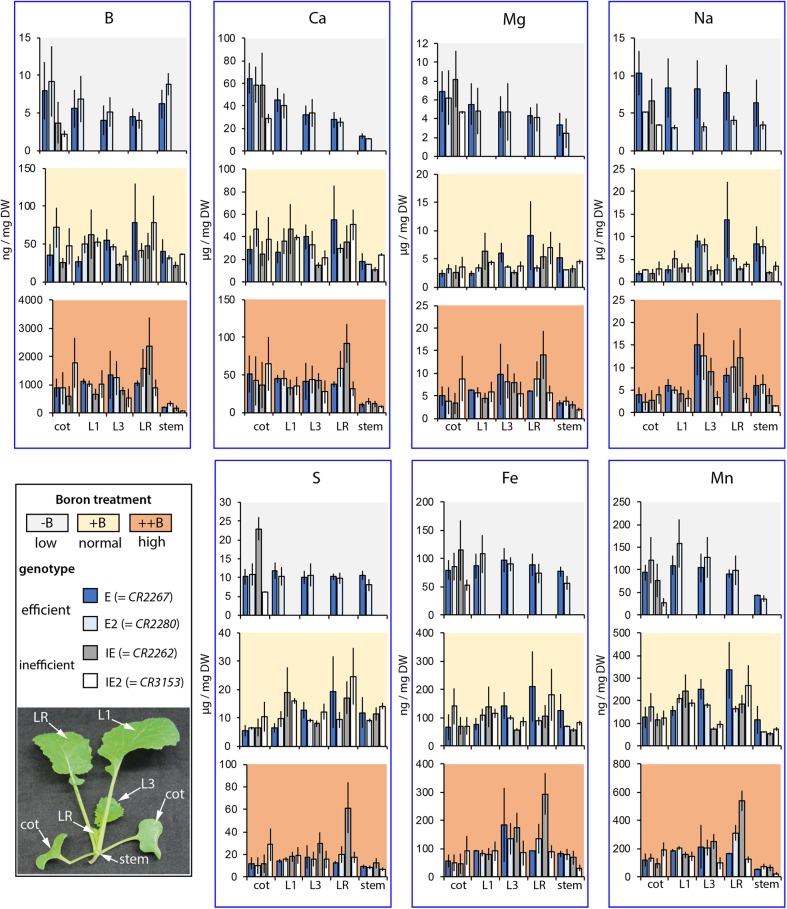
FIGURE 4.
Macro- and microelement concentrations of different B. napus plant parts. HR–ICP–MS-based element analysis of different aerial B. napus plant parts of two B deficiency tolerant (E = CR2267, E2 = CR2280) and two B deficiency sensitive (IE = CR2262, IE2 = CR3153) cultivars grown in an automated phenotyping facility under B-deficient (–), B-sufficient (+), or B-surplus (++) conditions. Bars represent concentrations of specific plant parts or organs (cot, cotyledon; L1, first vegetative leaf; L3, third vegetative leaf; RL, remaining leaves; stem, remaining stem tissue without leaves). Values show mean element concentrations in ng or μg per mg DW from n = 3 biological replicates ± SE.

