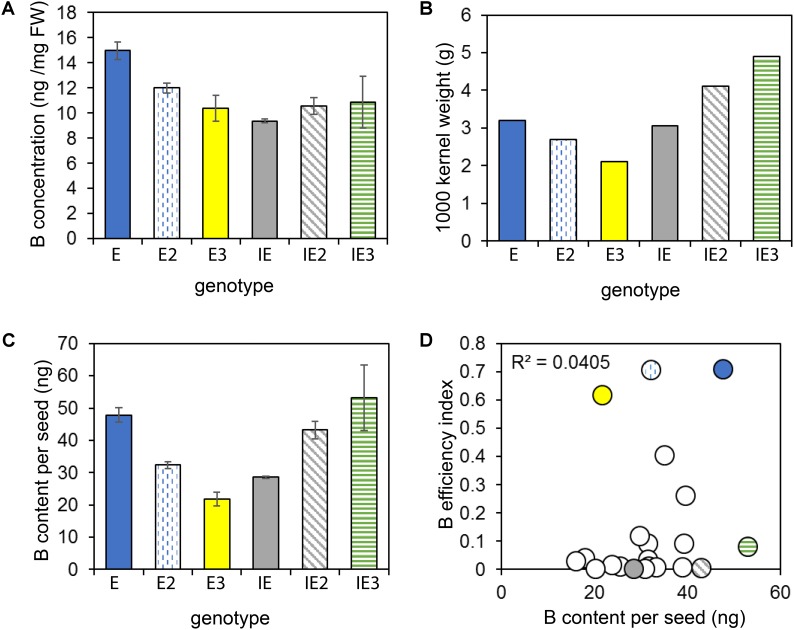
FIGURE 7.
B seed concentrations and contents. B seed concentration (A), 1000-kernel weights (B), and B seed contents (C) of selected B-efficient (E = CR2267, plain blue; E2 = CR2280, vertically dashed blue; E3 = CR2285, yellow) and inefficient (IE = CR2262, plain gray; IE2 = CR3153, diagonally dashed gray; IE3 = CR3035, horizontally dashed green) cultivars. (D) B efficiency does not correlate with B seed contents. B seed contents of 20 cultivars plotted against their BEIs. Values in A and (C) represent means from n = 3 measurements ± SE.

