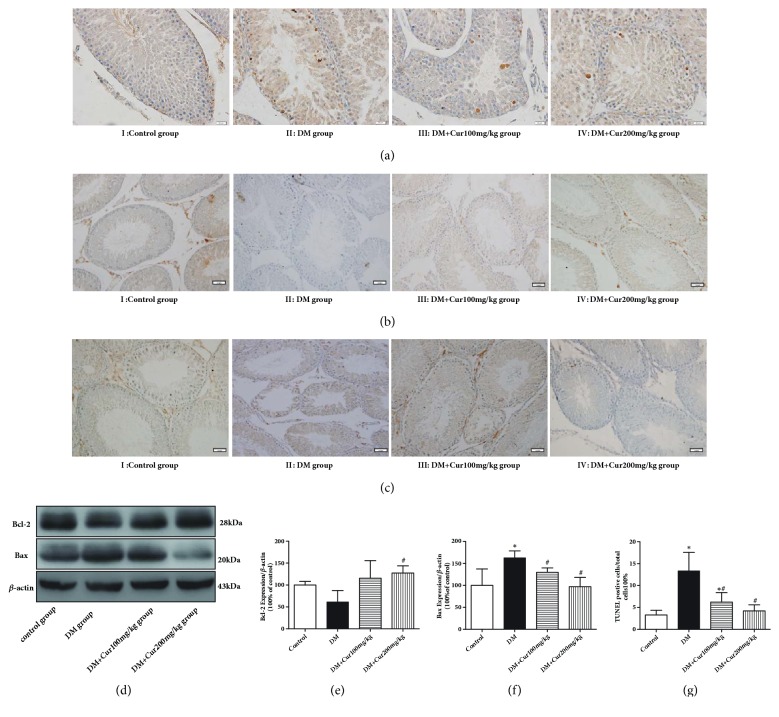
Figure 3.
Curcumin decreased DM-induced apoptosis in the testis. (a) Representative images of apoptotic cells stained by TUNEL (magnification=400×; bar indicates 20 μm). (b) Representative immunohistochemical staining of Bcl-2 (magnification=200×; bar indicates 50 μm). (c) Representative immunohistochemical staining of Bax (magnification=200×; bar indicates 50 μm). (d) Representative images of Bcl-2 and Bax protein; β-actin served as the loading control. (e) Quantitative analysis of Bcl-2 expression. (f) Quantitative analysis of Bax expression. (g) Analysis of TUNEL-positive cells. n=4. Values are presented as the mean±SD. ∗P<0.05 versus the control group. #P<0.05 versus the DM group.

