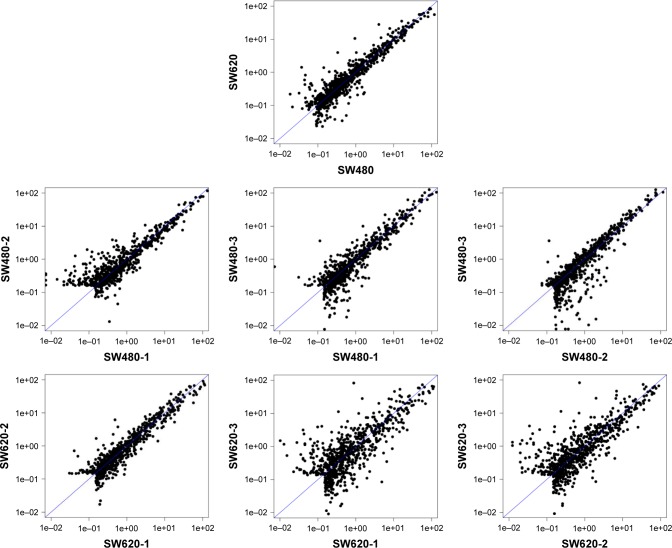
Figure 3.
The distribution of the probe on the chip (scatter plot) between six total RNAs of samples SW480-1, SW480-2, SW480-3, SW620-1, SW620-2, and SW620-3. The scatter plot reflects the repeatability between the chips or the groups. The better the repeatability is, the closer the diagonal line is.

