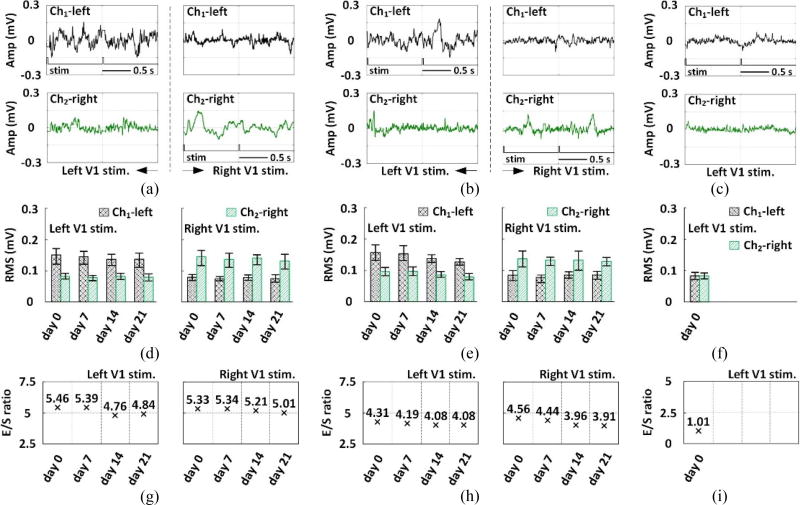
Figure 8.
Examples of 2 s long ECoG data recorded from the left and right V1 of (a) rat #2, (b) rat #3, and (c) the non-transfected rat, with V1 optical stimulation flags on the stimulated side. RMS values of the ECoG recorded from Ch1-left and Ch2-right in each experiment performed on (d) rat #2, (e) rat #3, and (f) the non-transfected rat, indicating the optically stimulated V1. Evoked-to-spontaneous (E/S) ECoG RMS ratios of the experiments performed on (g) rat #2 and (h) rat #3, and (i) the non-transfected rat.

