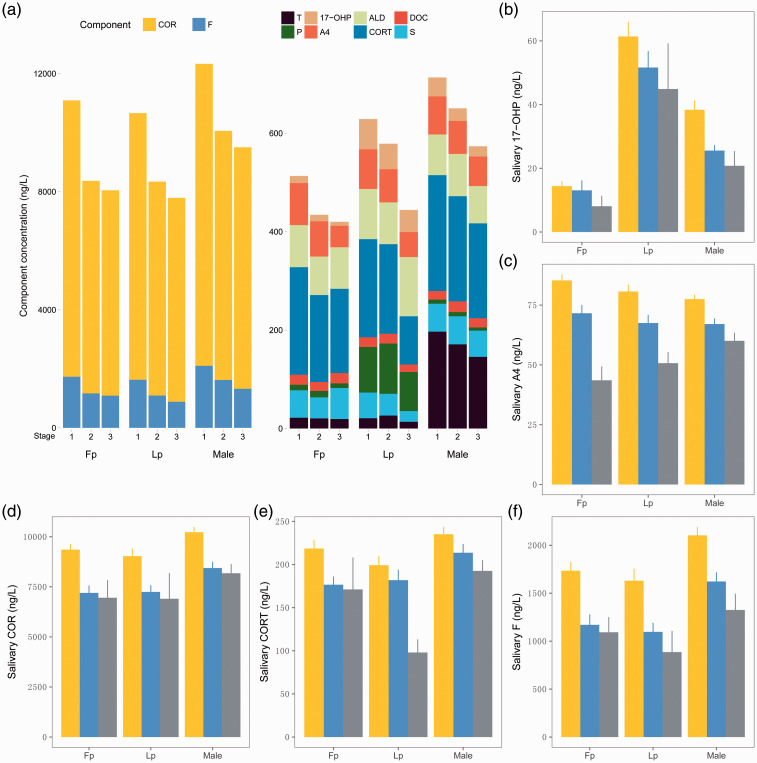
Figure 2.
Bar plot of salivary steroid hormones in different age groups, sexes, and female menstrual cycle stages. The number of patients in each of the 9 groups from left to right is 220, 81, 7, 101, 48, 4, 272, 121, and 28, respectively. (a) Bar plot of 10 salivary steroid hormones in different age groups, sexes, and female menstrual cycle stages. On the x-axis, 1 corresponds to the 20- to 29-year age group, 2 corresponds to the 30- to 39-year age group, and 3 corresponds to the ≥40-year age group. (b)–(f) Bar plots of salivary 17-OHP, A4, F, CORT, and COR levels in different age groups, sexes, and menstrual phases. The yellow, blue, and gray columns represent the 20- to 29-year, 30- to 39-year, and ≥40-year age groups, respectively. T, testosterone; A4, androstenedione; F, cortisol; COR, cortisone; P, progesterone; 17-OHP, 17α-hydroxyprogesterone; CORT, corticosterone; ALD, aldosterone; DOC, 11-deoxycorticosterone; S, 11-corticosterone.

