Short abstract
Objective
To perform early assessment of sepsis-induced myocardial dysfunction (SIMD) using strain/stress echocardiography.
Methods
A canine model of SIMD was established using intravenous injection of lipopolysaccharide (LPS, 2 mg/kg). Thirteen dogs were included, comprising an LPS-treated SIMD group (n = 7) and saline control group (n = 6). SIMD was assessed at various time-points using cardiac measurements including haemodynamics and echocardiography.
Results
Systolic and radial ventricular wall stress and circular ventricular wall stress (WSsc) were significantly lower in the sepsis group versus the control group at all time-points. Logistic regression analysis revealed an inverse correlation between stress rate of the front-posterior and bottom wall and left ventricle systolic wall strength. In contrast, a positive correlation was found between the mean velocity of circumferential fibre shortening (mVCF) or heart rate-adjusted mVCF (RVCF) and WSsc. Using regression equations, predicted values for mVCF and RVCF in animals with sepsis were significantly higher than measured values at 4- 5- and 6-h time-points.
Conclusions
These findings will further the understanding of pathophysiological alterations in SIMD at the early stage of sepsis, and suggest that strain rate may reflect the nature of myocardial contractility.
Keywords: Sepsis, myocardial dysfunction, echocardiography
Introduction
Sepsis has always been a curse for critically ill patients, and remains a high cause of mortality worldwide.1–3 Sepsis leads to haemodynamic alteration and profound hypovolaemia, which can induce myocardial depression or dysfunction.4 Myocardial depression is characterized by a decreased cardiac output that affects oxygen delivery, and occurs in approximately 40% of patients with sepsis.5,6 When sepsis is present, the mortality rate can increase up to 70%.7 Early stage septic shock is characterized by a hyperdynamic phase, with increased cardiac output, tachycardia and a reduction in systemic vascular resistance.3,8 Most patients then present with a hypodynamic phase, with depression of the left ventricular (LV) ejection fraction, hypotension and ventricular dilatation.8,9 This septic cardiomyopathy, unlike irreversible classic cardiomyopathy that is associated with high LV filling pressure, is potentially reversible and involves both the left and right ventricles, and presents with normal or low ventricular filling pressure. 10 The concept of reversible myocardial depression or dysfunction was first put forward in 1947, 11 in which myocardial depression factors were assumed to contribute to myocardial dysfunction in cases of haemorrhagic shock. 11 Transient myocardial dysfunction has also been reported in experimental models of septic shock. 12 There is an increasing research focus on earlier identification of sepsis-induced heart dysfunction. For example, two-dimensional speckle tracking imaging is reported to be more sensitive than conventional echocardiography for the early detection of myocardial dysfunction, 13 and strain echocardiography has been demonstrated to reveal myocardial dysfunction prior to significant changes in ejection fraction and cardiac output. 14
The aim of the current study was to establish a canine model of sepsis using intravenous (i.v.) injection of the endotoxin lipopolysaccharide (LPS) to assess early stage changes in myocardial function through strain/stress echocardiography within 6 h following LPS administration.
Materials and methods
Experimental design and animal model
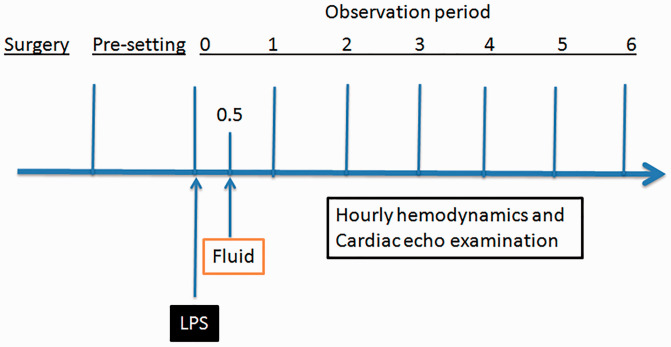
The present study was approved by the Animal Care and Use Committee of the Peking Union Medical College Hospital, Beijing, China, and was conducted according to the Guidelines for the care and use of laboratory animals (National Institutes of Health, publication No. 85–23, revised 1985). Thirteen healthy mongrel dogs (weight, 20 ± 0.22 kg) were provided by the Animal Facility of Peking Union Medical College Hospital. The animals had been housed using a 12 h light/12 h dark cycle, and were provided with free access to food and water. Seven dogs were assigned to the test (LPS) group and administered LPS, and six dogs were assigned to the control (saline) group, as illustrated in Figure 1. The general protocol, procedures, and haemodynamic calculations used in the current study have been published previously,15–17 and are described below.
Figure 1.
Schematic illustration of the experimental design to investigate a canine model of LPS-induced sepsis: Following surgical placement of arterial and venous catheters and initialization of mechanical ventilation, the animals were pre-set and observed for 30 min. Lipopolysaccharide (LPS; test group) or saline (control) was intravenously injected followed by fluid resuscitation 30 min later. Cardiac responses were then observed by hourly haemodynamic and echocardiographic measurements over a period of 6 h
Mechanical ventilation
Briefly, animals were fasted for 12 h prior to surgery. Following an intraperitoneal injection of 30 mg/kg pentobarbital (Ovation Pharmaceuticals, Deerfield, IL, USA), tracheal intubation was performed, and mechanical ventilation was initiated with a Servo Ventilator 900C (Siemens, Munich, Germany). Ventilation was set to the ‘Volume Controlled’ ventilation mode using the following parameters: tidal volume = 8–10 ml/kg, frequency = 15–20 breaths per min, positive end expiratory pressure = 0 mmHg, fraction of inspired oxygen (FiO2) = 30–50%, expiratory end tidal CO2 = 25–35 mmHg. FiO2 was maintained at ≥ 95% by monitoring tongue oxygen saturation.
Catheter placement
Femoral arterial and external jugular venous catheters (Edwards Laboratories, Santa Ana, CA, USA) were placed percutaneously using sterile technique. Fluid (Ringer’s solution or 0.9% physiological saline) and drugs were delivered through the venous catheter, and anaesthesia was maintained with 4 mg/kg/h pentobarbital (Ovation Pharmaceuticals) plus 0.1 mg/kg vecuronium (Bedford Laboratories™, Bedford, OH, USA) for initialization, followed by 0.05 mg/kg/h vecuronium for anaesthesia maintenance.
LPS injection
Following anaesthesia and initialization of mechanical ventilation, the animals were observed for 30 min (pre-setting period; Figure 1). A total of 2 mg/kg LPS (L2630; Sigma-Aldrich, St Louis, MO, USA) in an injection volume of 0.5 ml/kg was then administered and the animals observed for a further 2 min. The control group animals were injected with saline instead of LPS. At 30 min following LPS or saline administration, the animals were resuscitated using i.v. fluids. The cardiac responses to treatment were then observed using haemodynamic and echocardiography measurements recorded at hourly intervals for a period of 6 h. In addition, lactate levels were measured at hourly intervals using a GEM Premiere 3000 analyser and associated reagents (Instrumentation Laboratory, Bedford, Massachusetts, IL, USA), according to the manufacturer’s instructions.
Haemodynamic measurements
A pulse-induced contour cardiac output (PiCCO) catheter was placed into the femoral artery, and a Swan-Ganz catheter (Edwards Laboratories) was placed into the right external jugular vein. The catheters were connected to a PiCCO plus® system (Pulsion Medical Systems, Munich, Germany) and a transducer. The following parameters were obtained: systolic artery pressure (SAP), diastolic artery pressure, mean artery pressure, heart rate, central venous pressure, pulmonary artery wedge pressure, global end-diastolic volume, extra vascular lung water, stroke volume variation, pulse pressure variation, cardiac output, stroke volume, systemic vascular resistance (SVR), and pulmonary vascular resistance. Arterial blood gases were also measured hourly, including arterial oxygen saturation, partial pressure of oxygen, and partial pressure of carbon dioxide.
Echocardiography
Ventricular wall stress and strain values were obtained by echocardiography using a tissue Doppler imaging method. The Laplace formula was used to calculate ventricular wall stress and strain. Formulae used in the present study were as follows:
Teichholz formula: 18 LV end diastolic volume (LVEDV) = (7 / [2.4 + LV end diastolic diameter {LVEDD}]) × LVEDD3
- Quinones formula: 19 ejection fraction (EF) = (fractional shortening of the square of the minor axis [% ΔD2]) + ([1–ΔD2] [fractional shortening of the long axis {% ΔL}])
Grossman formula: 20 LV–systolic and radial ventricular wall stress (WSsm) = P × LVESD/(4H[1 + h/LVESD]); P = SAP; h = (interventricular septum [IVS] + LV posterior wall [LVPW] thickness)/2
LV–circular ventricular wall stress (WSsc) = P × R/2 h (1 + h/2R); P = SAP; R = (LVEDD + LVESD)/4; h = (IVS + LVPW thickness)/2 21
Stress rate of front and bottom wall (SR) = V1–V2/L 22
Laplace formula: 23 Wall stress (WS)/σ = Pr/2 h; P = inner ventricular pressure, r = radius of inner ventricle, h = thickness of ventricle.
Mean velocity of circumferential fibre shortening (mVCF) = LVEDD–LVESD/(LVEDD × LV ejection time) 24
Heart rate-adjusted mVCF (RVCF) = mVCF × heart rate/60
Left ventricle systolic wall strength (REWSm) = WSsm × ejection time × heart rate20,25
All ultrasound parameter measurements were performed independently by two investigators (XW and RY). Each investigator took three measurements for each parameter measured, and the mean of these measurements for each parameter were used in the subsequent analyses. The intra- and interobserver reliability were optimum for video recordings, with kappa values of 0.81 and 0.75, respectively.
Light microscopy specimen preparation and morphological observation
At the end of the 6 h observation period, each dog was euthanised using pentobarbital and the heart was excised. The anterior wall of the left ventricle was cut longitudinally and photographed. The tissue of the anterior wall of the left ventricle was collected and fixed in 2.5% (v/v) glutaraldehyde-polyoxymethylene solution immediately following euthanasia. Tissue samples were dehydrated using ethanol and embedded in paraffin wax. Serial paraffin sections (4 µm) were obtained and stored at 37°C for >12 h. The sections were immersed in three consecutive washes of xylene for 5 min to remove the paraffin, and then hydrated with five consecutive washes of ethanol in descending concentrations of 100, 95, 80, 70, and 50% in deionized water, respectively. The sections were then stained with haematoxylin and eosin (H&E), and changes in organizational structure were visualized using an Olympus BX-45 light microscope (Olympus, Tokyo, Japan).
Statistical analyses
Data are presented as mean ± SD and were analysed using SPSS software, version 13.0 (SPSS Inc., Chicago, IL, USA). Parametric data were analysed using Student’s (independent samples) t-test, data revealing heterogeneity of variance were analysed using the nonparametric Mann–Whitney U-test and continuous quantitative data were analysed using repeated measures analysis of variance. Correlation and dependence were analysed using Pearson's correlation coefficient or Spearman's rank correlation coefficient. Logistic regression was used to calculate the predicted value of variables. A P value of < 0.05 was considered to indicate statistical significance. The intra- and interobserver reliability for video recordings were calculated using Cohen's kappa coefficient for consistency.
Results
General features of the canine LPS model of sepsis
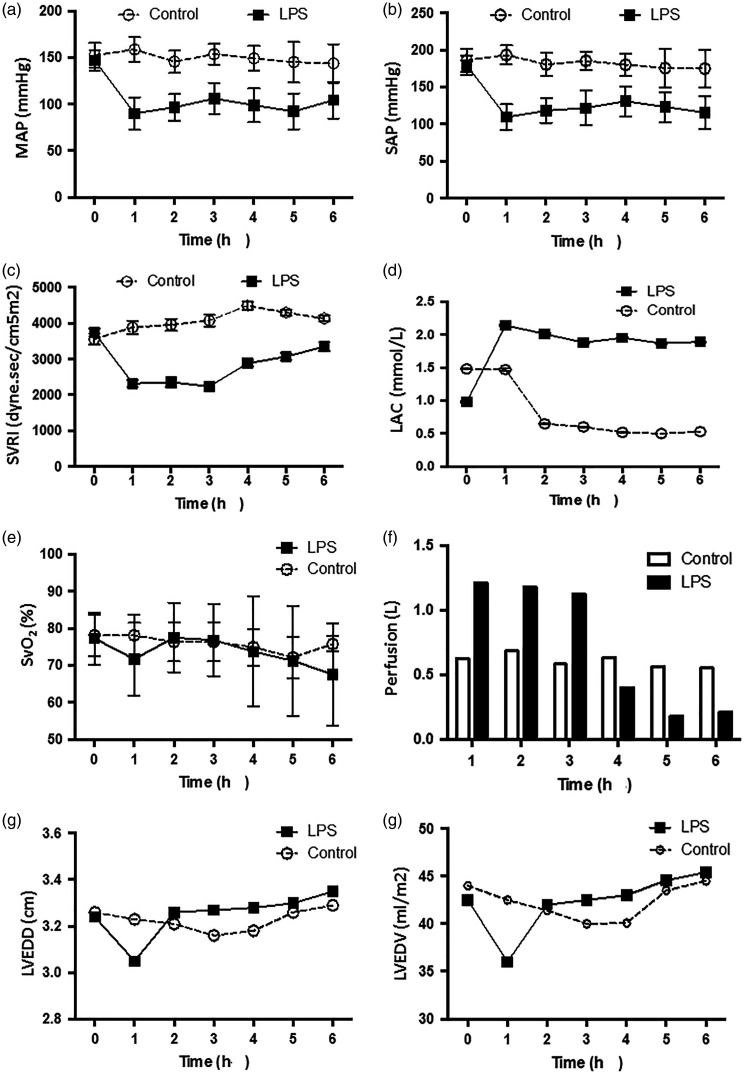
Following LPS injection and fluid resuscitation, there were no statistically significant differences between the control and LPS-injected groups in terms of heart rate, temperature, central venous pressure, pulmonary artery wedge pressure, and global end diastolic volume (data not shown). However, mean artery pressure (Figure 2a), SAP (Figure 2), and SVR index (Figure 2c) were significantly lower in the sepsis group than in the control group during the 6-h observation period (P <0.05). Moreover, for each of these parameters in the LPS group, there was a statistically significant decrease at each time-point compared with pre-injection values (0 h; P > 0.05).
Figure 2.
Comparison of (a) mean artery pressure (MAP); (b) systolic artery pressure (SAP); (c) systemic vascular resistance index (SVRI); (d) lactate (LAC) level; (e) oxygen saturation of mixed venous blood (SvO2); (f) perfusion; (g) left ventricular end diastolic diameter (LVEDD); and (h) left ventricular end diastolic volume (LVEDV) between a canine model of LPS-induced sepsis (n = 7) and saline-treated controls (n = 6), recorded at hourly intervals over 6 h following injection: Data presented as mean ± SD
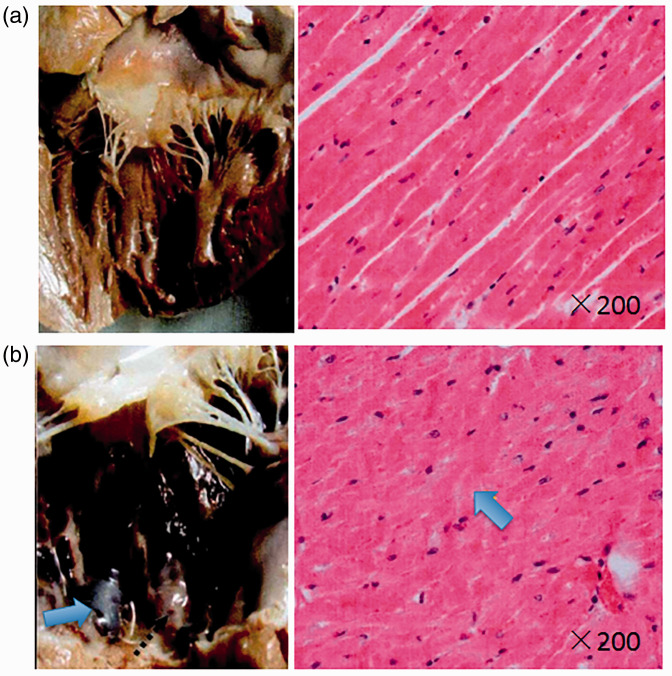
Cardiac output and stroke volume gradually decreased in the LPS-treated group and were significantly different from pre-injection values (0 h) at 6 h following LPS injection (cardiac output, 2.95 ± 0.85 versus 1.96 ± 0.43, P = 0.036; and stroke volume, 18.17 ± 4.41 versus 11.91 ± 4.03, P = 0.029, respectively). In the control group, lactate levels were significantly decreased from 2 h following saline injection versus pre-injection levels (0 h; P <0.05), and were significantly increased in the LPS group at 1 h following LPS injection, remaining continuously high (P <0.05 versus pre-injection levels [0 h]; Figure 2d). There was no statistically significant change in oxygen saturation of mixed venous blood (SvO2) in either group throughout the 6-h observation period (e.g., control group, 78.13 ± 5.64 at time 0 versus 72.18 ± 5.65 at 6 h; P = 0.098). In addition, there was no statistically significant between-group difference in SvO2 (P = 0.133, Figure 2e). During fluid resuscitation, the total volume of perfused solution was not significantly different between the LPS group (4.26 ± 0.63 l) and control group (3.70 ± 0.97 l). However, a large portion of the overall perfused volume in the LPS group (80%) was delivered within 4 h following LPS injection (3.90 ± 0.72 l), and was significantly higher than that delivered to the control animals during the same period (2.60 ± 0.72 l; P = 0.008; Figure 2f). Analysis of LVEDD and LVEDV showed no statistically significant differences at any time-points between the control and LPS-treated groups (Figure 2g & 2 H). Histopathological observation of the heart at the end of each experiment showed that, compared with the control group (Figure 3a), the heart papillary muscle in the LPS group (Figure 3b) displayed haemorrhage and oedema. H&E staining of microscopic structures revealed that myocardial fibres in the LPS group had oedema and rupture.
Figure 3.
Representative general and microscopic morphology of the left ventricle anterior wall in a canine model of LPS-induced sepsis and saline-treated controls: Compared with the control group (a, left), the papillary muscle of the LPS group (b, left) displayed haemorrhage and oedema (arrow). Haematoxylin and eosin staining revealed oedema and rupture of the myocardial fibres in the LPS group (b, right; arrow)
Comparison of cardiac functions between the control and sepsis groups
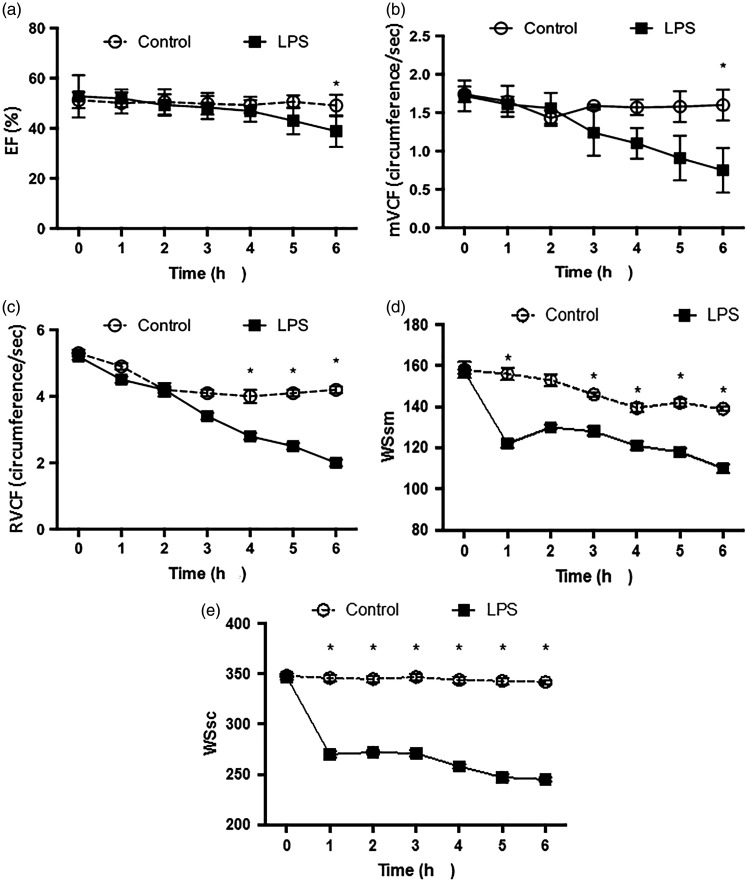
Cardiac function parameters, including EF, mVCF, and RVCF were shown to differ between the LPS and control groups. In terms of EF and mVCF, the between-group differences reached significance at the 6-h time-point (P <0.05; Figure 4a and 4b, respectively). There were statistically significant between-group differences in RVCF at the 4-, 5- and 6-h time-points (P <0.05; Figure 4c).
Figure 4.
Comparison of (a) the ejection fraction (EF); (b) mean velocity of circumferential fibre shortening (mVCF); (c) heart rate-adjusted mVCF (RVCF); (d) systolic and radial ventricular wall stress (WSsm); and (e) circular ventricular wall stress (WSsc) between a canine model of LPS-induced sepsis (n = 7) and saline-treated controls (n = 6), recorded at hourly intervals over 6 h following injection: Data presented as mean ± SD (*P <0.05, LPS sepsis group versus controls; repeated measures analysis of variance)
Myocardial wall stress and stress rate
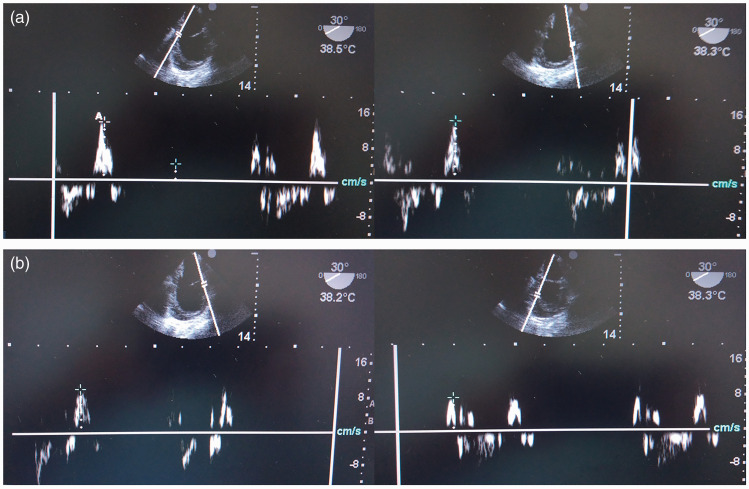
Myocardial wall stress was further evaluated using the peak velocity of systolic myocardial contraction (Sm), by taking transoesophageal echocardiography measurements of the mean peak velocity of two points on the front ventricular wall (SFm), average peak velocity of two points on the posterior ventricular wall (Shm) and average peak velocity of all four points (Smm). There were statistically significant differences in SFm and Smm between the LPS and control groups at the 4-, 5-, and 6-h time-points, while between-group differences in Shm were only statistically significantly at the 6-h time-point (P <0.05; Figure 5 and Table 1). The stress rate of the front and bottom wall (SR) and stress rate of the front-posterior and bottom wall (SRt) were significantly lower in the LPS sepsis group versus the control group at the 4-, 5- and 6-h time-point (P <0.05; Table 2), but there were no between-group differences in the stress rate of the posterior bottom wall (SRh) at any time-point.
Figure 5.
Representative transoesophageal echocardiography images used to assess the peak velocity of systolic myocardial contraction (Sm) in a canine model of LPS-induced sepsis: (a) mean peak velocity of two points on the front ventricular wall (SFm); (b) average peak velocity of two points on the posterior ventricular wall (Shm).
Table 1.
Comparison of average peak velocity of two points on the front ventricular wall (SFm), average peak velocity of two points on the posterior ventricular wall (Shm), and average peak velocity of all four points (Smm) in a canine model of lipopolysaccharide (LPS)-induced sepsis (n = 7) and saline-treated controls (n = 6)
| Time, h |
SFm |
Shm |
Smm |
||||||
|---|---|---|---|---|---|---|---|---|---|
| Control | LPS | Statistical significance | Control | LPS | Statistical significance | Control | LPS | Statistical significance | |
| 0 | 9.47 ± 1.92 | 9.34 ± 1.12 | NS | 9.15 ± 1.32 | 9.87 ± 1.68 | NS | 9.31 ± 1.6 | 9.6 ± 1.23 | NS |
| 1 | 9.42 ± 1.93 | 8.80 ± 1.09 | NS | 9.18 ± 0.98 | 8.93 ± 1.64 | NS | 9.3 ± 1.35 | 8.86 ± 1.13 | NS |
| 2 | 9.53 ± 0.51 | 8.35 ± 1.04 | NS | 8.43 ± 1.24 | 8.23 ± 1.43 | NS | 8.98 ± 0.6 | 8.29 ± 1.16 | NS |
| 3 | 9.39 ± 1.59 | 7.88 ± 0.95 | NS | 9.48 ± 2.04 | 7.53 ± 0.98 | NS | 9.44 ± 1.76 | 7.7 ± 0.8 | NS |
| 4 | 8.89 ± 1.84 | 7.17 ± 0.91 | P = 0.041 | 7.98 ± 1.9 | 6.95 ± 0.94 | NS | 8.43 ± 1.83 | 7.06 ± 0.7 | P = 0.029 |
| 5 | 8.31 ± 0.57 | 6.99 ± 0.11 | P = 0.011 | 8.12 ± 1.64 | 6.05 ± 0.74 | NS | 8.22 ± 0.93 | 6.52 ± 0.6 | P = 0.027 |
| 6 | 8.81 ± 1.22 | 6.17 ± 6.05 | P = 0.013 | 7.36 ± 1.09 | 5.77 ± 0.35 | P = 0.002 | 8.08 ± 0.78 | 5.97 ± 0.56 | P = 0.006 |
Data presented as mean ± SD.
NS, no statistically significant between-group differences at P > 0.05 (Student’s t-test).
Table 2.
Comparison of stress rate of front and bottom wall (SR), stress rate of the posterior bottom wall (SRh), and stress rate of the front-posterior and bottom wall (SRt) between a canine model of lipopolysaccharide (LPS)-induced sepsis (n = 7) and saline-treated controls (n = 6)
| Time, h |
SR |
SRh |
SRt |
||||||
|---|---|---|---|---|---|---|---|---|---|
| Control | LPS | Statistical significance | Control | LPS | Statistical significance | Control | LPS | Statistical significance | |
| 0 | 1.05 ± 0.09 | 1.02 ± 0.14 | NS | 1.01 ± 0.1 | 1.10 ± 0.15 | NS | 1.03 ± 0.08 | 1.03 ± 0.23 | NS |
| 1 | 1.13 ± 0.1 | 1.00 ± 0.1 | NS | 0.97 ± 0.04 | 1.06 ± 0.19 | NS | 1.04 ± 0.11 | 1.05 ± 0.12 | NS |
| 2 | 1.0 ± 0.18 | 0.83 ± 0.1 | NS | 0.85 ± 0.13 | 1.01 ± 0.09 | NS | 0.95 ± 0.12 | 0.88 ± 0.12 | NS |
| 3 | 0.92 ± 0.18 | 0.79 ± 0.11 | NS | 0.79 ± 0.11 | 0.86 ± 0.10 | NS | 0.87 ± 0.06 | 0.86 ± 0.14 | NS |
| 4 | 0.99 ± 0.1 | 0.64 ± 0.11 | P = 0.009 | 0.71 ± 0.01 | 0.82 ± 0.17 | NS | 0.86 ± 0.15 | 0.72 ± 0.15 | P = 0.036 |
| 5 | 0.93 ± 0.07 | 0.67 ± 0.1 | P = 0.014 | 0.71 ± 0.2 | 0.70 ± 0.11 | NS | 0.83 ± 0.15 | 0.68 ± 0.09 | P = 0.046 |
| 6 | 0.99 ± 0.05 | 0.47 ± 0.05 | P = 0.001 | 0.57 ± 0.06 | 0.57 ± 0.07 | NS | 0.82 ± 0.18 | 0.53 ± 0.08 | P = 0.002 |
Data presented as mean ± SD.
NS, no statistically significant between-group differences at P > 0.05 (Student’s t-test).
To further evaluate cardiac function, systolic and radial ventricular wall stress (WSsm) and circular ventricular wall stress (WSsc) were calculated and compared, and both were found to be significantly lower in the LPS sepsis group at all time-points versus the control group (P <0.05; Figure 4d and 4e), except WSsm at the 2-h time-point.
Cardiac function assessment by myocardial stress
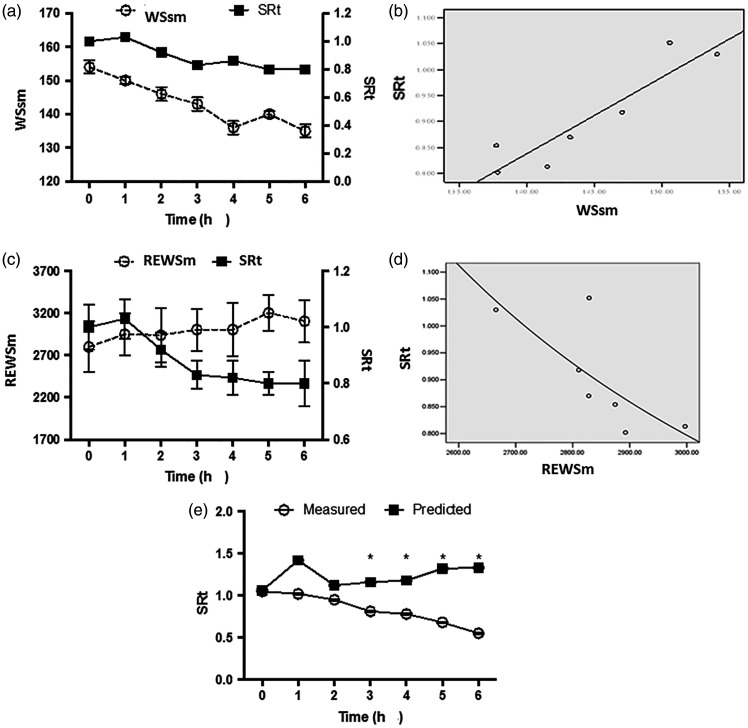
The trend in control-group values for WSsm and SRt were similar (Figure 6a), and logistic regression analyses of the two parameters resulted in the following equation: SRt = 0.009 × WSsm – 0.247 (r = 0.798, P = 0.001, Figure 6b). Using this regression equation, the predicted SR, SRh and SRt in the sepsis group were obtained and compared with those of the measured values (Table 3). The predicted values were significantly higher than the measured values at later time-points (P <0.05).
Figure 6.
Correlations between systolic and radial ventricular wall stress (WSsm) and stress rate of the front-posterior and bottom wall (SRt), and between REWSm and SRt in canine saline-treated controls (n = 6): (a) WSsm and SRt as a function of time; (b) scatter plot of WSsm and SRt; (c) REWSm and SRt as a function of time; (d) scatter plot of REWSm and SRt; and (e) Comparison of predicted and measured values of SRt in a canine model of LPS-induced sepsis (n = 7); *P < 0.05, predicted versus measured values (repeated measures analysis of variance)
Table 3.
Comparison of the predicted and measured stress rate of front and bottom wall (SR), stress rate of the posterior bottom wall (SRh), and stress rate of the front-posterior and bottom wall (SRt) over time in a canine model of lipopolysaccharide-induced sepsis (n = 7)
| Time, h |
SR |
SRh |
SRt |
||||||
|---|---|---|---|---|---|---|---|---|---|
| Measured | Predicted | Statistical significance | Measured | Predicted | Statistical significance | Measured | Predicted | Statistical significance | |
| 0 | 1.03 ± 0.14 | 1.12 ± 0.12 | NS | 1.10 ± 0.15 | 1.12 ± 0.12 | NS | 1.07 ± 0.13 | 1.12 ± 0.12 | NS |
| 1 | 1.00 ± 0.1 | 0.87 ± 0.07 | NS | 1.06 ± 0.19 | 0.87 ± 0.07 | NS | 1.03 ± 0.13 | 0.87 ± 0.07 | NS |
| 2 | 0.84 ± 0.1 | 0.92 ± 0.07 | NS | 1.01 ± 0.09 | 0.92 ± 0.07 | NS | 0.93 ± 0.12 | 0.92 ± 0.07 | NS |
| 3 | 0.79 ± 0.11 | 0.90 ± 0.07 | NS | 0.86 ± 0.10 | 0.90 ± 0.07 | NS | 0.81 ± 0.1 | 0.90 ± 0.07 | P = 0.033 |
| 4 | 0.65 ± 0.11 | 0.85 ± 0.07 | P = 0.03 | 0.82 ± 0.17 | 0.85 ± 0.07 | NS | 0.73 ± 0.15 | 0.85 ± 0.07 | P = 0.034 |
| 5 | 0.67 ± 0.1 | 0.80 ± 0.07 | P = 0.049 | 0.70 ± 0.11 | 0.80 ± 0.07 | P = 0.04 | 0.68 ± 0.08 | 0.80 ± 0.07 | P = 0.005 |
| 6 | 0.48 ± 0.05 | 0.75 ± 0.08 | P = 0.001 | 0.57 ± 0.07 | 0.75 ± 0.08 | P = 0.01 | 0.52 ± 0.07 | 0.75 ± 0.08 | P = 0.001 |
Data presented as mean ± SD.
NS, no statistically significant between-group differences at P > 0.05 (Student’s t-test).
The correlation between left ventricle systolic wall strength (REWSm) and SRt was also analysed by logistic regression in control animals (Figure 6c), and an inverse correlation was found, with the following equation: SRt = e (–2.46 + 6689.3/REWSm); r = –0.765 (P = 0.049, Figure 6d). A predicted SRt value was then calculated using this regression equation and compared with measured values. The predicted values were significantly higher than the measured values at the 3-, 4-, 5- and 6-h time-points (P <0.05; Figure 6e).
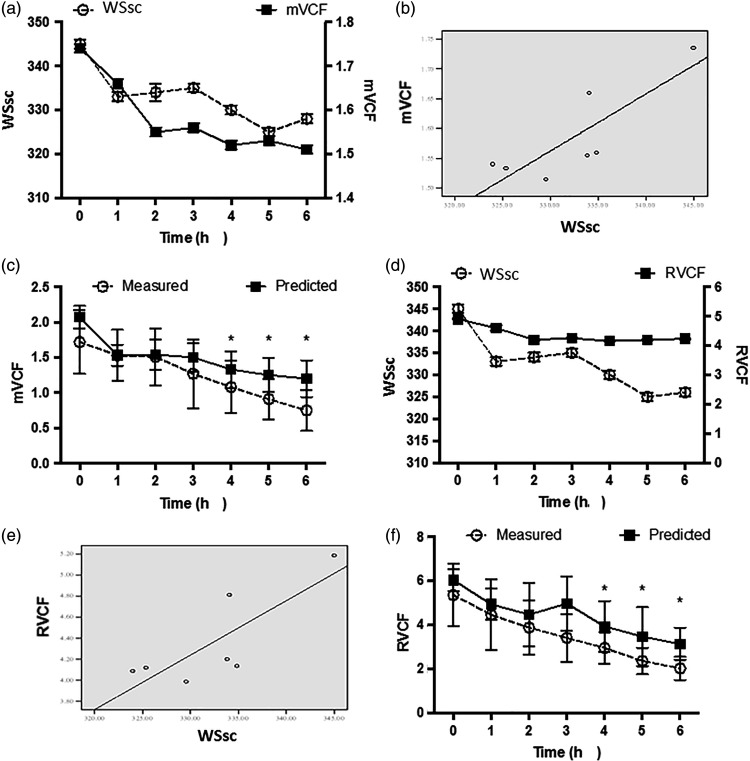
The correlation between WSsc and mVCF (Figure 7a) or RVCF (Figure 7d) in control animals was analysed by logistic regression, and produced the following equations: mVCF = 0.01 × WSsc – 1.31 (r = 0.831, P = 0.011, Figure 7b) and RVCF = 0.052 × WSsc – 9.504 (r = 0.805, P = 0.015, Figure 7e). Predicted values for mVCF and RCVF in animals with LPS-induced sepsis were then calculated and were found to be significantly higher than measured values at the 4-, 5- and 6-h time-points, respectively (P <0.05; Figure 7c and 7f).
Figure 7.
Correlations between circular ventricular wall stress (WSsc) and mean velocity of circumferential fibre shortening (mVCF) or heart rate-adjusted mVCF (RVCF) in canine saline-treated controls (n = 6), and comparison of predicted and measured values in a canine model of LPS-induced sepsis (n = 7) using logistic regression equations: (a) WSsc and mVCF as a function of time; (b) scatter plot of WSsc and mVCF; (c) predicted and measured mVCF values in a canine model of LPS-induced sepsis; (d) WSsc and RVCF as a function of time; (e) scatterplot of WSsc and RVCF; and (f) predicted and measured RVCF values in a canine model of LPS-induced sepsis; *P < 0.05, predicted versus measured values (repeated measures analysis of variance)
Discussion
Currently, sepsis-induced myocardial dysfunction (SIMD) is a risk factor and main predictor of poor outcome in patients with sepsis.26 The concept of SIMD was proposed in 1984, 27 when the existence of myocardial dysfunction was demonstrated in patients with septic shock using radionuclide ventriculography and a simultaneous study of cardiac output by thermodilution. Patients who survived (13/20) had an initial LV ejection fraction (LVEF) < 40% (P <0.05 versus non-survivors), as well as a different mean end-systolic volume and end-diastolic volume versus non-survivors. 27 These changes were sustained for 4 days and then gradually returned to normal. Paradoxically, non-survivors had normal LVEF and ventricle volumes. LV dilatation occurred and compensated for the decreased cardiac output and ventricular contractility by the Frank-Starling mechanism.28 In addition, reversibility of myocardial dysfunction within 7–10 days was associated with better outcome. Studies into SIMD, however, have not substantially improved the outcomes of SIMD treatment in the last 30 years. Moreover, controversies remain concerning SIMD pathophysiology and treatment strategies, with many treatment strategies still at the experimental stage. In the current study, an experimental model of sepsis with appropriate similarity to human sepsis (evidenced by alterations in mean artery pressure, SAP and SVR) was established using i.v. administration of LPS. Using this canine model of sepsis, the acute dynamic alterations of cardiac function were investigated. Parameters of cardiac function, including EF and mVCF, were found to be significantly altered in the sepsis group as early as 4 h following LPS injection, suggesting cardiac dysfunction may occur at a very early stage of sepsis.
An echocardiographic study with a cohort of 34 patients with severe sepsis or septic shock, 29 comprised 15 patients with SIMD (44%; defined as having fractional area contraction <50%) who received more fluid charges and had a higher mortality rate than the controls (47% versus 16% in the control group, P = 0.04). In the current study, parameters including the Sm, SFm, Shm, and Smm were obtained by transoesophageal echocardiography in the saline-injected control animals and were used to estimate the alteration of parameters in the sepsis group. The strain rate reflects the nature of myocardial contractility, and the current authors note that Shm was significantly different between the sepsis and control group at the 6-h time-point only, but SFm and Smm reached significance at the 4-, 5-, and 6-h time-points, suggesting that the posterior ventricular wall is able to tolerate LPS. In addition, WSsm and WSsc were calculated, and the correlation among the parameters was analysed. REWSm and SRt were found to be inversely correlated (SRt = e (–2.46 + 6689.3 / REWSm). By contrast, mVCF or RVCF were found to be positively correlated with WSsc (mVCF = 0.01 × WSsc – 1.31; and RVCF = 0.052 × WSsc – 9.504). The correlation formulae could be used to predict the values of SRt, mVCF and RCVF in animals with sepsis, and potentially used to calculate and identify myocardial dysfunction earlier than conventional parameters. This may provide early evidence for appropriate treatment of sepsis-induced myocardial dysfunction.
The concept of septic cardiomyopathy has evolved, and includes alterations in the myocardial phenotype. 2 This recent definition recognizes the importance of myocardial depression or dysfunction in sepsis, including a low cardiac index or echocardiographic evidence of cardiac dysfunction, 30 and the proposed mechanism underlying the pathophysiology of myocardial dysfunction is sepsis-induced functional rather than anatomical abnormalities. 31 These results suggest that conceptualizing cardiac dysfunction in sepsis as simply the result of functional change oversimplifies the issue and that the importance of myocardial structural changes in sepsis should not be ignored.
Although the echocardiography method has various advantages, some shortcomings remain. The motion of myocardial contraction is complex and three-dimensional. In the present study, apical two-chamber images and short axis images were used to measure myocardial strain values, and myocardial strain values were calculated from the long axis direction and circumferential direction. In order to improve the quality of echocardiography, speckle tracking echocardiography 32 or myocardial contract perfusion echocardiography 33 can also be used. None of the current imaging methods, however, can simultaneously record movement and deformation in three directions at the same time, and three-dimensional imaging of cardiac function remains the focus of future research. The tissue Doppler imaging method of measuring cardiac strain, used in the present study, is an advanced method with shortcomings, such as angle and location. Therefore, future research should use improved technologies and more advanced methods to verify the present results. The present results may also be limited by the small sample size.
In conclusion, the findings of the current study may help to further the understanding of pathophysiological alterations in the early stages of sepsis in patients with SIMD. The results also suggest that strain rate is the parameter that reflects the nature of myocardial contractility. Cardiac function assessment by myocardial stress could identify myocardial dysfunction at an early stage. Such an assessment may provide early evidence for the appropriate treatment of sepsis-induced myocardial dysfunction.
Declaration of conflicting interests
The authors declare that there is no conflict of interest.
Funding
Funding for this research was received from Beijing Municipal Natural Science Foundation (grant No. 7162158).
References
- 1.Annane D, Aegerter P, Jars-Guincestre MC, et al. Current epidemiology of septic shock: the CUB-Rea Network. Am J Respir Crit Care Med 2003; 168: 165–172. DOI: 10.1164/rccm.2201087. [DOI] [PubMed] [Google Scholar]
- 2.Celes MR Prado CM andRossi MA.. Sepsis: going to the heart of the matter. Pathobiology 2013; 80: 70–86. DOI: 10.1159/000341640. [DOI] [PubMed] [Google Scholar]
- 3.Silva E, Pedro Mde A, Sogayar AC, et al. Brazilian Sepsis Epidemiological Study (BASES study). Crit Care 2004; 8: R251–R260. DOI: 10.1186/cc2892. [DOI] [PMC free article] [PubMed] [Google Scholar]
- 4.Kakihana Y, Ito T, Nakahara M, et al. Sepsis-induced myocardial dysfunction: pathophysiology and management. J Intensive Care 2016; 4: 22. DOI: 10.1186/s40560-016-0148-1. [DOI] [PMC free article] [PubMed] [Google Scholar]
- 5.Rivers E, Nguyen B, Havstad S, et al. Early goal-directed therapy in the treatment of severe sepsis and septic shock. N Engl J Med 2001; 345: 1368–1377. DOI: 10.1056/NEJMoa010307. [DOI] [PubMed] [Google Scholar]
- 6.Fernandes CJ Jr. Akamine N andKnobel E.. Cardiac troponin: a new serum marker of myocardial injury in sepsis. Intensive care Med 1999; 25: 1165–1168. [DOI] [PubMed] [Google Scholar]
- 7.Blanco J, Muriel-Bombin A, Sagredo V, et al. Incidence, organ dysfunction and mortality in severe sepsis: a Spanish multicentre study. Crit Care 2008; 12: R158. DOI: 10.1186/cc7157. [DOI] [PMC free article] [PubMed] [Google Scholar]
- 8.Parker MM andParrillo JE.. Septic shock. Hemodynamics and pathogenesis. JAMA 1983; 250: 3324–3327. [PubMed] [Google Scholar]
- 9.Krishnagopalan S, Kumar A, Parrillo JE, et al. Myocardial dysfunction in the patient with sepsis. Curr Opin Crit Care 2002; 8: 376–388. [DOI] [PubMed] [Google Scholar]
- 10.Vieillard-Baron A. Septic cardiomyopathy. Ann Intensive Care 2011; 1: 6. DOI: 10.1186/2110-5820-1-6. [DOI] [PMC free article] [PubMed] [Google Scholar]
- 11.Wiggers CJ. Myocardial depression in shock; a survey of cardiodynamic studies. Am Heart J 1947; 33: 633–650. [DOI] [PubMed] [Google Scholar]
- 12.Fernandes CJ Jr.andde Assuncao MS.. Myocardial dysfunction in sepsis: a large, unsolved puzzle. Crit Care Res Pract 2012; 2012: 896430. DOI: 10.1155/2012/896430. [DOI] [PMC free article] [PubMed] [Google Scholar]
- 13.Li T, Liu JJ, Du WH, et al. 2D speckle tracking imaging to assess sepsis induced early systolic myocardial dysfunction and its underlying mechanisms. Eur Rev Med Pharmacol Sci 2014; 18: 3105–3114. [PubMed] [Google Scholar]
- 14.Hestenes SM, Halvorsen PS, Skulstad H, et al. Advantages of strain echocardiography in assessment of myocardial function in severe sepsis: an experimental study. Crit Care Med 2014; 42: e432–e440. DOI: 10.1097/CCM.0000000000000310. [DOI] [PubMed] [Google Scholar]
- 15.Minneci PC, Deans KJ, Hansen B, et al. A canine model of septic shock: balancing animal welfare and scientific relevance. Am J Physiol Heart Circ Physiol 2007; 293: H2487–H2500. DOI: 10.1152/ajpheart. 00589.2007. [DOI] [PubMed] [Google Scholar]
- 16.Nemzek JA Hugunin KM andOpp MR.. Modeling sepsis in the laboratory: merging sound science with animal well-being. Comp Med 2008; 58: 120–128. [PMC free article] [PubMed] [Google Scholar]
- 17.Petrucco O Rao PS andCavanagh D.. Endotoxin shock in the dog. Alterations in hemodynamic and hematologic parameters during bolus and infusion studies . Am J Obstet Gynecol 1972; 114: 1060–1065. [PubMed] [Google Scholar]
- 18.Dittoe N, Stultz D, Schwartz BP, et al. Quantitative left ventricular systolic function: from chamber to myocardium. Criti Care Med 2007; 35: S330–S339. [DOI] [PubMed] [Google Scholar]
- 19.Quinones MA, Waggoner AD, Reduto LA, et al. A new, simplified and accurate method for determining ejection fraction with two-dimensional echocardiography. Circulation 1981; 64: 744–753. [DOI] [PubMed] [Google Scholar]
- 20.Brodie BR McLaurin LP andGrossman W.. Combined hemodynamic-ultrasonic method for studying left ventricular wall stress: comparison with angiography. Am J Cardiol 1976; 37: 864–870. [DOI] [PubMed] [Google Scholar]
- 21.Arts T, Bovendeerd PH, Prinzen FW, et al. Relation between left ventricular cavity pressure and volume and systolic fiber stress and strain in the wall. Biophys J 1991; 59: 93–102. DOI: 10.1016/S0006-3495(91)82201-9. [DOI] [PMC free article] [PubMed] [Google Scholar]
- 22.Gilman G, Khandheria BK, Hagen ME, et al. Strain rate and strain: a step-by-step approach to image and data acquisition. J Am Soc Echocardiogr 2004; 17: 1011–1020. DOI: 10.1016/j.echo.2004.04.039. [DOI] [PubMed] [Google Scholar]
- 23.Moriarty TF. The law of Laplace. Its limitations as a relation for diastolic pressure, volume, or wall stress of the left ventricle. Circ Res 1980; 46: 321–331. [DOI] [PubMed] [Google Scholar]
- 24.Ruschhaupt DG, Sodt PC, Hutcheon NA, et al. Estimation of circumferential fiber shortening velocity by echocardiography. J Am Coll Cardiol 1983; 2: 77–84. [DOI] [PubMed] [Google Scholar]
- 25.Quinones MA, Mokotoff DM, Nouri S, et al. Noninvasive quantification of left ventricular wall stress. Validation of method and application to assessment of chronic pressure overload . Am J Cardiol 1980; 45: 782–790. [DOI] [PubMed] [Google Scholar]
- 26.Merx MW andWeber C.. Sepsis and the heart. Circulation 2007; 116: 793–802. [DOI] [PubMed] [Google Scholar]
- 27.Parker MM, Shelhamer JH, Bacharach SL, et al. Profound but reversible myocardial depression in patients with septic shock. Ann Intern Med 1984; 100: 483–490. [DOI] [PubMed] [Google Scholar]
- 28.Solaro RJ. Mechanisms of the Frank-Starling law of the heart: the beat goes on. Biophys J 2007; 93: 4095–4096. [DOI] [PMC free article] [PubMed] [Google Scholar]
- 29.Charpentier J, Luyt CE, Fulla Y, et al. Brain natriuretic peptide: A marker of myocardial dysfunction and prognosis during severe sepsis. Crit Care Med 2004; 32: 660–665. [DOI] [PubMed] [Google Scholar]
- 30.Annane D Bellissant E andCavaillon JM.. Septic shock. Lancet 2005; 365: 63–78. DOI: 10.1016/S0140-6736(04)17667-8. [DOI] [PubMed] [Google Scholar]
- 31.Rudiger A andSinger M.. Mechanisms of sepsis-induced cardiac dysfunction. Crit Care Med 2007; 35: 1599–1608. DOI: 10.1097/01.CCM.0000266683.64081.02. [DOI] [PubMed] [Google Scholar]
- 32.Sitia S Tomasoni L andTuriel M.. Speckle tracking echocardiography: A new approach to myocardial function. World J Cardiol 2010; 2: 1–5. DOI: 10.4330/wjc.v2.i1.1. [DOI] [PMC free article] [PubMed] [Google Scholar]
- 33.Lepper W, Belcik T, Wei K, et al. Myocardial contrast echocardiography. Circulation 2004; 109: 3132–3135. DOI: 10.1161/01.CIR.0000132613.53542.E9. [DOI] [PubMed] [Google Scholar]


