
Figure 3. Knockout of miRNA Genes Phenocopies miRSP.
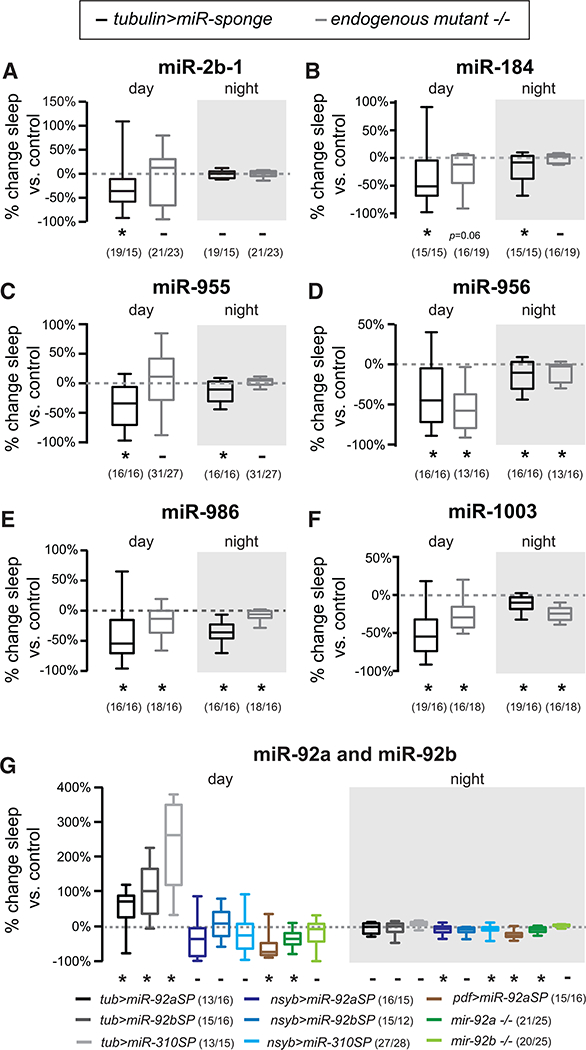
(A-F) Change in total day and night sleep for six miRNAs: miR-2b-1 (A), miR-184 (B), mir-955 (C), miR-956 (D), miR-986 (E), and miR-1003 (F). Change in tubulin>miRSP sleep relative to scramble is plotted in black. Change in knockout flies’ sleep relative to genetic control is plotted in gray.
(G)Percent change in day and night sleep relative to scramble or genetic background control after inhibition of miR-92 family members. miRNAs were either inhibited by expression of sponges via tubulinGal4 (gray plots), nsybGal4 (blue plots), or PDFGal4 (brown) or through knockout of the miR gene (green plots).
Whiskers represent maxima and minima. *p < 0.05, -p > 0.06 using Mann-Whitney test. n values are reported next to the genotype. See also Figure S1.