
Figure 3. Reactogenicity at the site of vaccine inoculation.
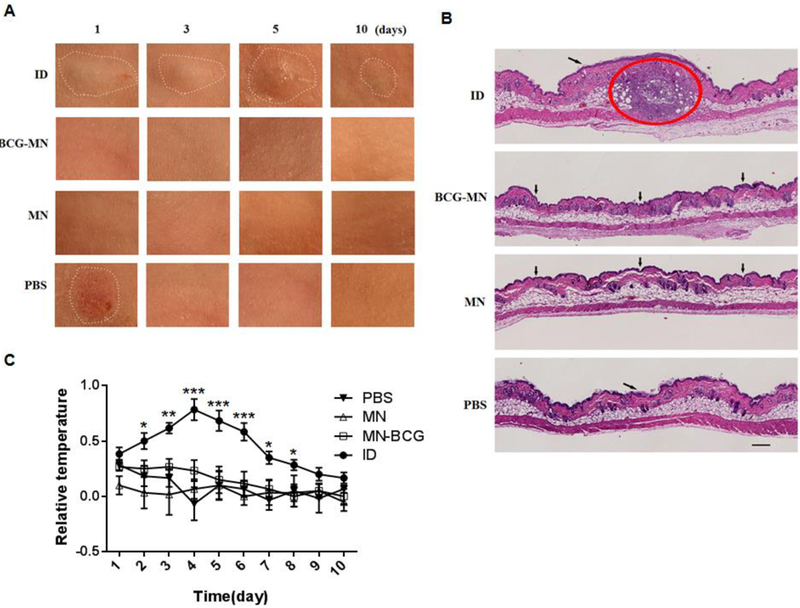
A. Photos were taken in 1, 3, 5 and 10 days after inoculation. Only areas of inflammatory and abnormal skins were outlined by a white-dot line in all panels. B. Cross-sections of the inoculation site were H&E stained 3 days after inoculation and scanned by Nanozoomer; a red circle indicates an area of inflammation induced by BCG in the skin and arrows point the sites of a hypodermic needle or microneedle insertion. Scale bar, 200 μm. C. Differences of skin surface temperature between the inoculation site and a distant area were recorded daily for 10 days (n=6). Statistical significance was analyzed by ANOVA, *P<0.05,**P<0.01, and ***P<0.001 in the presence or absence of BCG.