
Figure 4. Intracellular cytokine productions in NK and T cells.
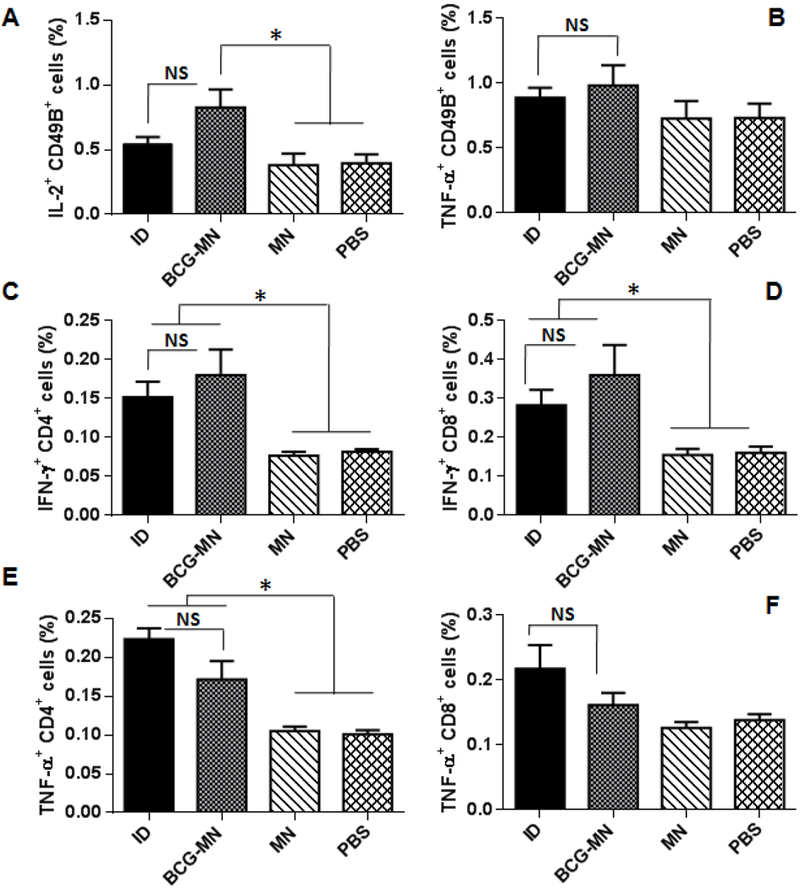
IL-2 (A) and TNF-α (B) production by CD49B+ cells were assessed in the blood samples one week after vaccination. IFN-γ+CD4+ cells (C) and IFN-γ+CD8+ cells (D), and TNF-α+CD4+ cells (E) and TNF-α+CD8+ cells (F) were analyzed in blood samples four weeks post-vaccination. Data are presented as mean±SEM (n=6). Statistical significance was analysed by ANOVA *P<0.05 and NS, no significance. All experiments were repeated twice with similar results.