
Fig. 10.
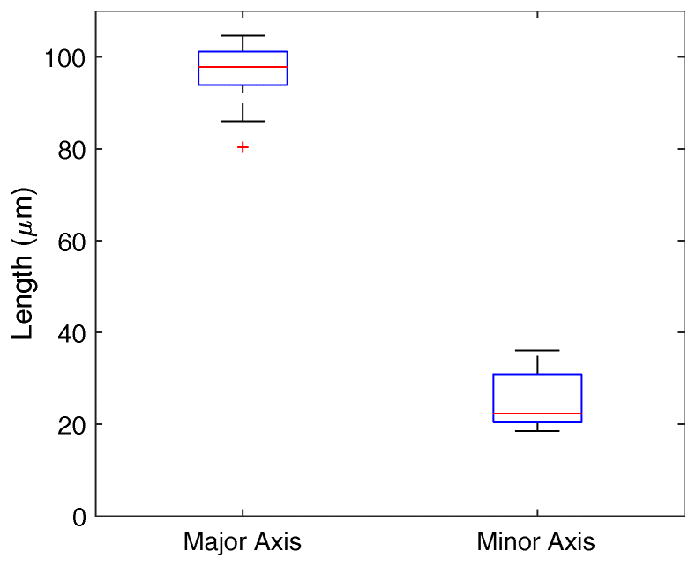
Lengths of major and minor axes of perforations. The bottom and top edges of blue box indicate the 25th and 75th percentiles, respectively. The mean value is halfway between the 25th and 75th percentiles. The horizontal red central mark indicates the median. The vertical whiskers extend to the most extreme data points not considered outliers, and outliers are plotted individually using the ‘+’ symbol.