
Figure 3.
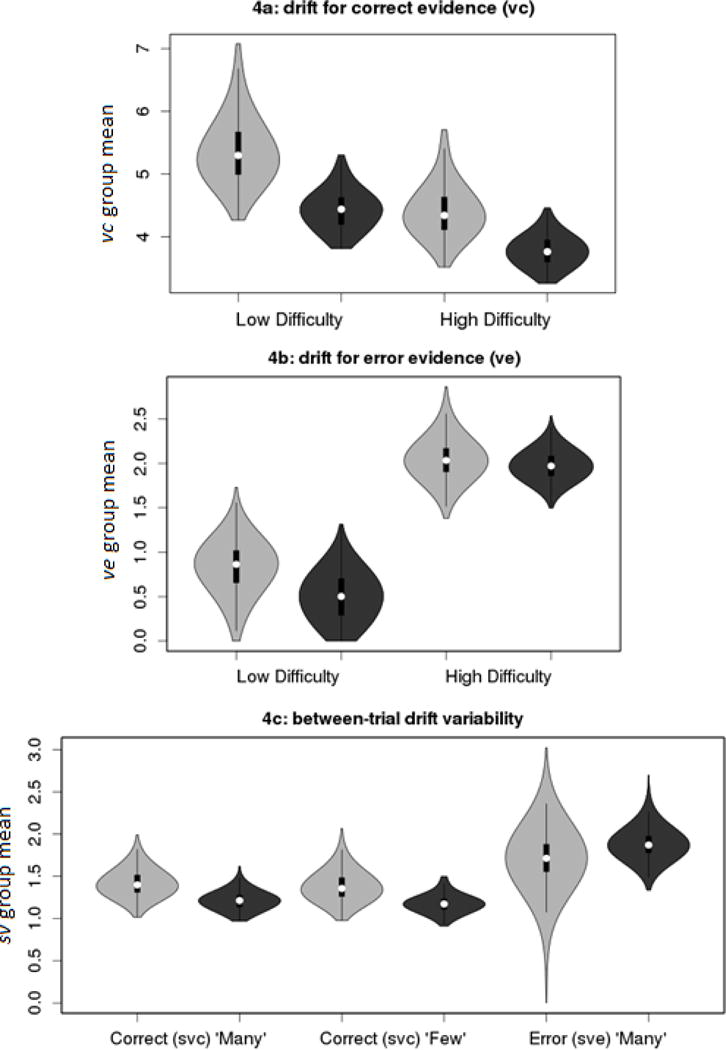
Violin plots representing the posterior density of group μ parameters for the average drift rate for correct evidence (vc), average drift rate for error evidence (ve) and between-trial drift variability for correct (svc) and error (sve) evidence. Light gray = Control; Dark gray = ADHD.