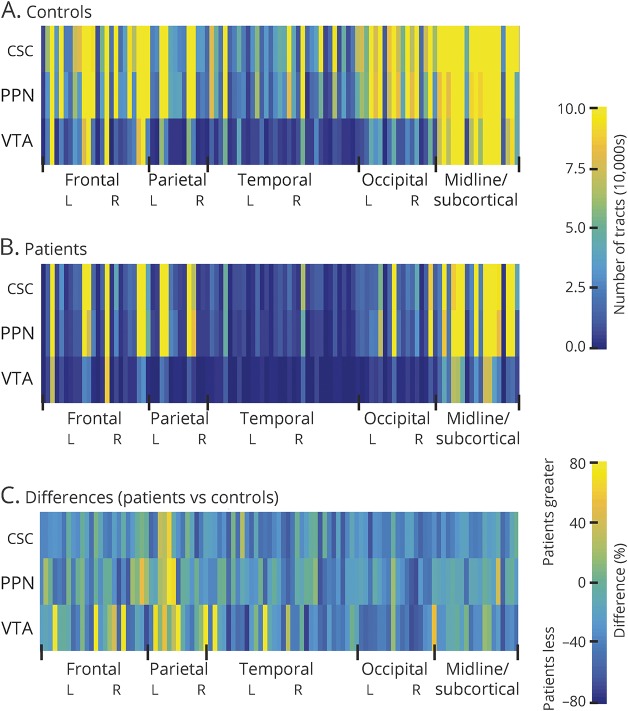
Figure 2. ARAS structural connectivity patterns in patients with epilepsy vs controls.
(A and B) Color maps representing mean structural connectivity values between 3 ARAS structures and 105 cortical/subcortical regions across controls (A) and patients with epilepsy (B). (C) Color map depicting structural connectivity differences (%) in patients vs controls across all regions, showing mostly decreases in patients. For controls, the mean number of tracts from each of 3 ARAS regions to each of 105 cortical/subcortical regions ranged from 78,775 to 217,049, while in patients, this range was 51,431 to 152,950. Twenty-six patients and 26 matched controls. ARAS = ascending reticular activating system; CSC = cuneiform/subcuneiform nuclei; PPN = pedunculopontine nucleus; VTA = ventral tegmental area.

