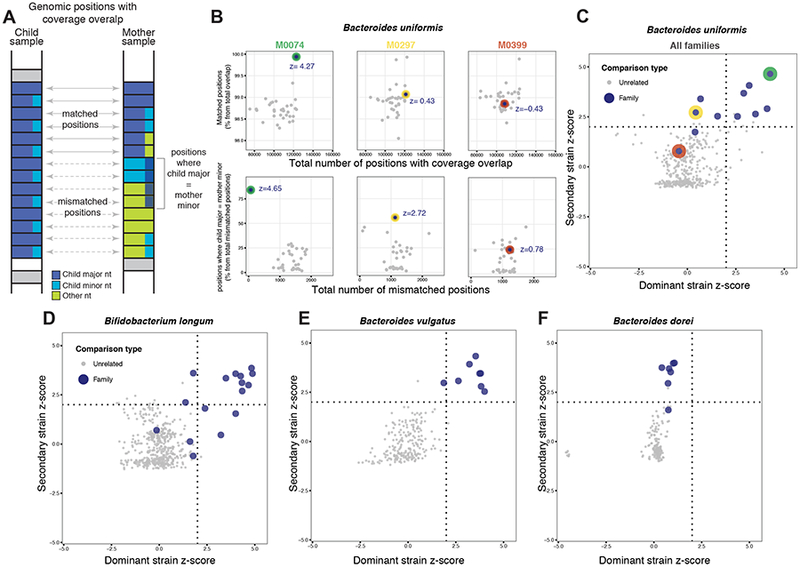
Figure 2: Patterns of dominant and secondary strains shared in mother-child pairs.

(A) Schematic view of matched and mismatched nucleotides counts based on reads aligning to species-specific marker genes. At each position of shared coverage, counts of major nucleotide matched positions are enumerated relative to those positions where the child’s major nucleotide matches the mother’s minor nucleotide. (B) Data from three mother-child pairs. Relative counts of major (top) and minor (bottom) nucleotide match events are shown together with their z-scores. (C–F) Plots depicting the distribution of dominant- and secondary-strain z-scores for individual species. Families occuring in the upper right, upper left, or bottom left quadrants show evidence of maternal transmission of dominant strain, secondary strain, or none, respectively, for that species (see Methods). Red, green, and yellow dots represent families shown in panel B.
