
Figure 2 -. Performance of AWS vs. local GPU workstation.
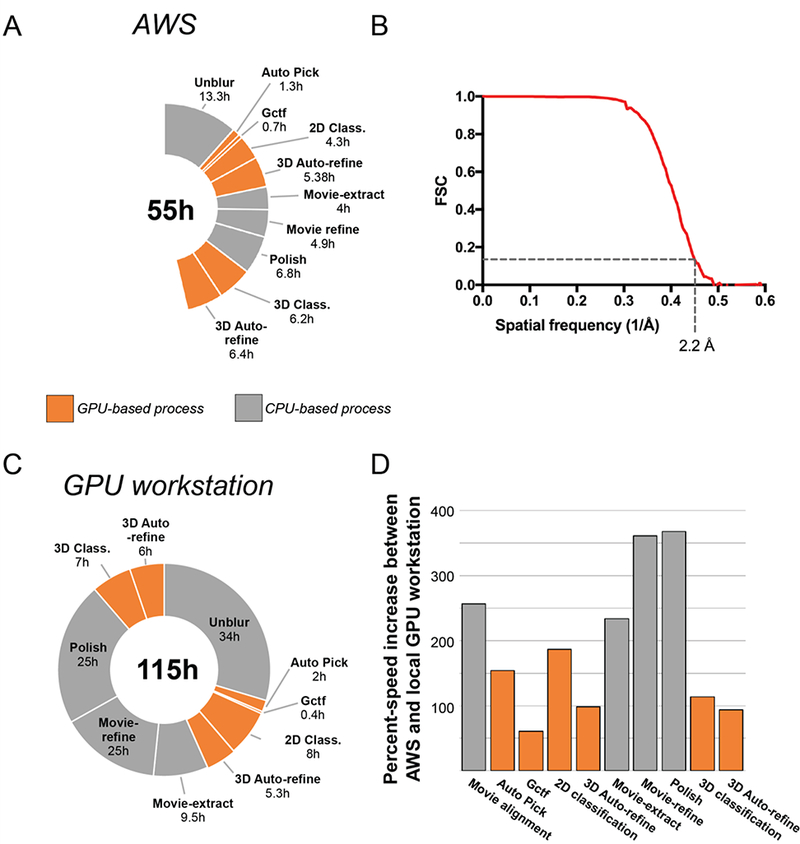
Processing times (A) and FSC curve (B) for the determination of a 2.2 Å ß-galactosidase structure on AWS. (C) Processing times from the determination of 2.2 Å ß-galactosidase structure on GPU workstation (Kimanius et al. 2016). (D) Comparison of percent speed-up increases between AWS and a GPU workstation.