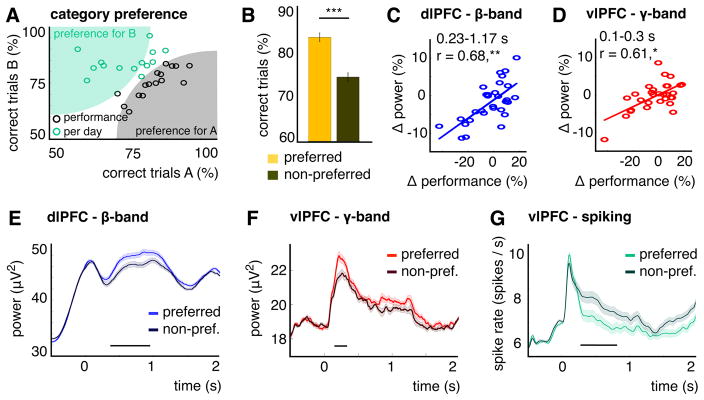
Figure 4. Category preference in behavior, LFP-power and spiking.
(A) Performance (% correct trials) per category for each recording day (circles). Data points away from the main diagonal indicate a behavioral preference for a particular category on that day (A in black or B in green). (B) Performance for preferred and non-preferred categories. Error bars show +/−1 SE. Asterisks indicate the significance level (with *** p< .001). (C, D) dlPFC-beta power (C) and vlPFC-gamma power (D) difference between categories, averaged over significant time intervals (0.23–1.17 s for (C), 0.1–0.3 s for (D), see Figure S3), plotted against performance difference. Asterisks indicate the significance level (with * p< .05, ** p< .01). (E–G) dlPFC-beta power (E), vlPFC-gamma power (F) and vlPFC-spiking (G) for preferred/non-preferred categories (averaged over channels with a significant correlation ((E, F), see Figure S3) or all MUA channels with category information (G). Shaded areas show +/−1 SE. Horizontal lines show significant time intervals (p< .05, time-cluster corrected).

