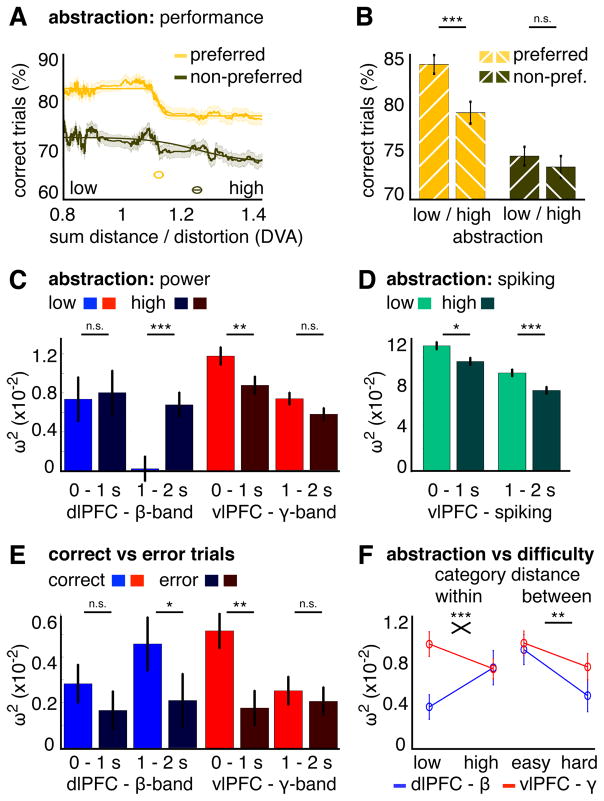
Figure 5. Category abstraction in behavior, LFP-power and spiking.
(A) Performance (% correct trials) as a function of exemplar distortion for preferred and non-preferred categories. Shaded areas show +/−1 SE. Lines show the sigmoid fit and inset circles show its inflection point. (B) Performance for low and high distortion separately for preferred and non-preferred categories. (C, D) Category information (ω2) for low and high distortion separately for sample (0–1 s) and delay epochs (1–2 s) for dlPFC-beta power, for vlPFC-gamma power (C) and for vlPFC-spking (D). (E) Category information (ω2) for correct and error trials separately for sample (0–1 s) and delay epochs (1–2 s) for dlPFC-beta power and vlPFC-gamma power. (F) Category information (ω2) for dlPFC-beta power and vlPFC-gamma power between 0–2 s for low/high distortion (left) and median split by between-category distance (right; easy = above median, hard = below median). For (B–F), error bars show +/−1 SE. Asterisks indicate the significance level (with n.s. = not significant, * p< .05, ** p< .01, *** p< .001). Additional analyses for time course stability are shown in Figure S4.

