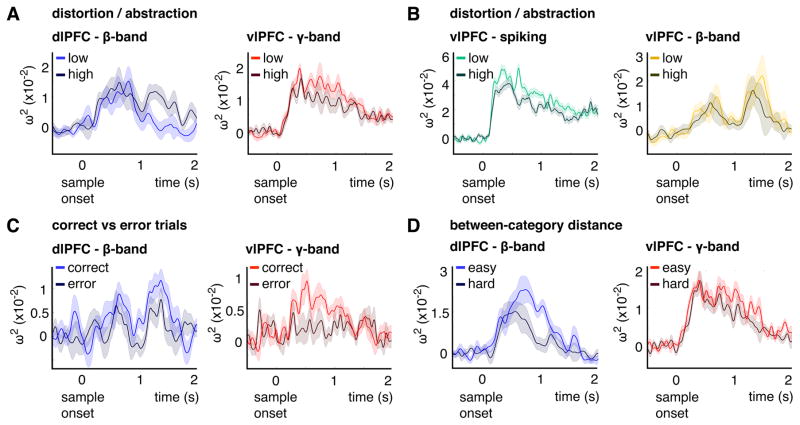
Figure 6. Time-series data for category information.
(A) Category information (ω2) as a function of time from sample onset for low (light hue) and high distortion (dark hue) for dlPFC-beta power (blue) and vlPFC-gamma power (red) averaged over the 10% most informative electrodes per area (see Figure S1). (B) Category information (ω2) as a function of time from sample onset for low (light hue) and high distortion (dark hue) for vlPFC-spiking (green) averaged over all channels that contained significant category information for spiking (242 MUA channels) and vlPFC-beta power (yellow) averaged over the 10% most informative electrodes per area (see Figure S1). (C) Category information (ω2) as a function of time from sample onset for correct (light hue) and error trials (dark hue) for dlPFC-beta power (blue) and vlPFC-gamma power (red) averaged over the 10% most informative electrodes per area (see Figure S1). (D) Category information (ω2) as a function of time from sample onset for above Median (easy) between-category distance (light hue) and below Median (hard) between-category distance for dlPFC-beta power (blue) and vlPFC-gamma power (red) averaged over the 10% most informative electrodes per area (see Figure S1). For (A–D), shaded areas show +/−1 SE. See also Figure S4.

