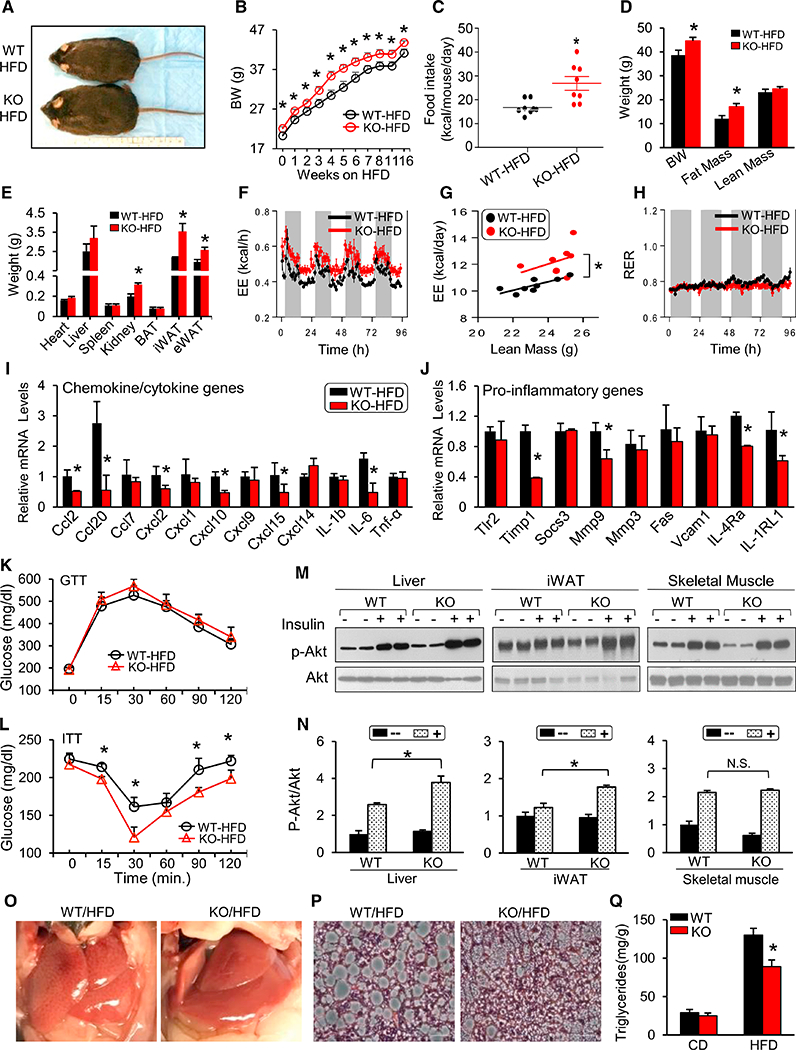
Figure 4. Inflammation and Insulin Resistance Associated with a HFD Are Ameliorated Because of Hsp20 Deficiency.

(A) Gross morphology of WT and KO mice after 16-week HFD feeding.
(B) Body weight of WT and KO mice on an HFD (n = 7–8 per group).
(C) Food intake of WT and KO mice fed with HFD (n = 8 per genotype).
(D and E) Body composition (D) and weight of various tissues (E) in WT and KO mice.
(F) Energy expenditure after 12 weeks of HFD feeding (n = 8 per genotype).
(G) Linear regression analysis of energy expenditure against lean body mass.
(H) RER in WT and KO mice from (F).
(I and J) mRNA levels of chemokines and cytokines (I) and genes involved in pro-inflammatory pathways (J) in iWAT ofWT and KO mice fed an HFD for16weeks.
(K and L) IPGTT (K) and IPITT (L) analyses were performed in WT and KO mice after 16 weeks of HFD feeding (n = 5 per genotype).
(M and N) Phosphorylation of AKT (Ser-473) in iWAT, liver, and skeletal muscle (M) after insulin stimulation and quantification (N) (n = 5 per genotype).
(O and P) Gross morphology (O) and representative liver sections (H&E) (P) from WT and KO mice after 16-week HFD feeding (n = 5).
(Q) Hepatic triglyceride content after 16 hr fasting.
*p < 0.05. Data are represented as the mean ± SEM. See also Figure S4.
