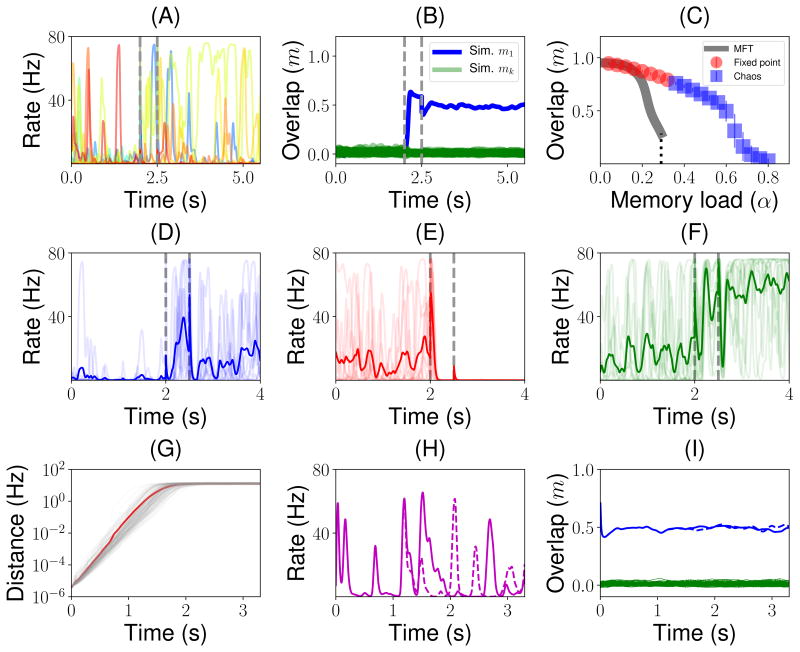
Figure 6.
Chaotic background and retrieval states, for a network with parameters as in Fig. 3, except for the learning rate (A = 10.65) and memory load (α = 0.48 in all panels except in C). (A) Firing rate dynamics for a randomly sampled subset of 10 neurons of a simulated network when a familiar stimulus (i.e. one of the stored patterns) is presented. (B) Dynamics of the overlaps before, during and after the presentation of a familiar stimulus. Green traces shown all the overlaps computed numerically from the network simulation corresponding to each of the stored patterns except the one with the presented pattern, shown in blue. (C) Overlap vs memory load. Gray curve: MFT. Red circles: simulations in which the dynamics converge to fixed point attractors. Blue square: simulations in which the dynamics converge to chaotic states. (D–F) Dynamics of the firing rate of three example neurons in 10 different trials (random initial conditions - transparent traces). Trial-averaged firing rate (over 20 trials) is shown with an opaque trace. (G) Light gray traces: exponential initial growth followed by saturation of the distance between pairs of retrieval states corresponding to the same stored pattern but slightly different initial conditions (see Methods). Red curve: average distance between pairs of retrieval states with slightly different initial conditions. (H) Firing rate of a single neuron starting from two slightly different initial conditions (continuous vs dashed). (I) Overlaps with the retrieved pattern (blue) and all other stored patterns (green) again for a pair of initial conditions (continuous vs dashed). As in Fig. 3, in A, B and D–F vertical dashed lines indicate the beginning and the end of the presentation period.

