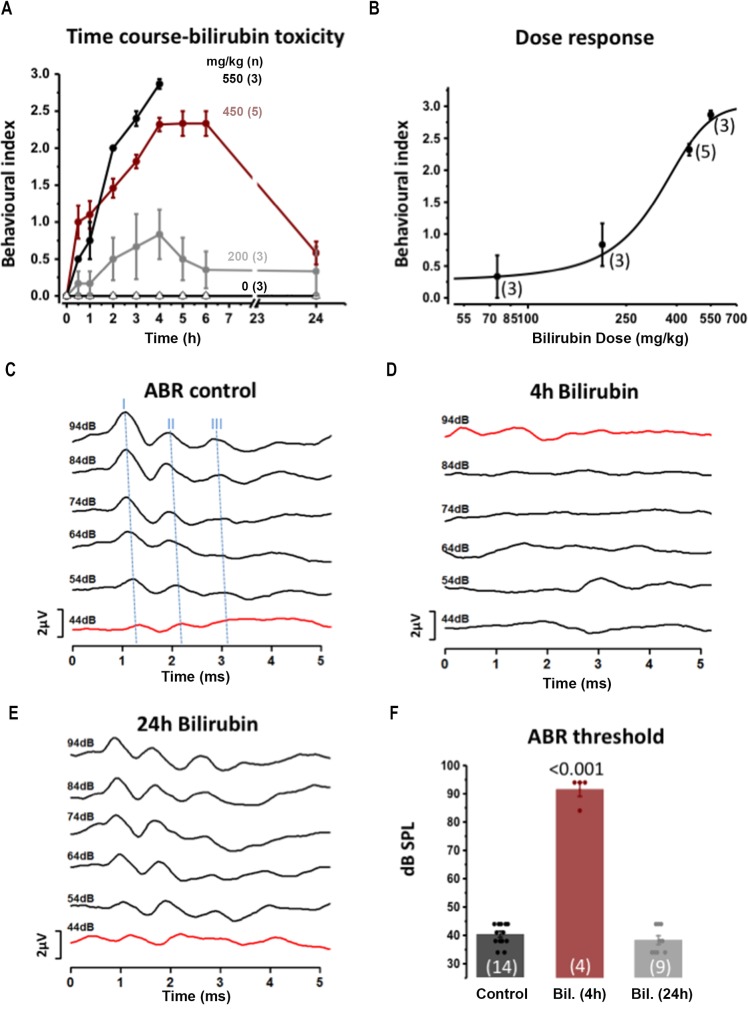
Fig 2. A mouse model for hyperbilirubinemia shows bilirubin toxicity on movement behavior and the auditory threshold.
A behavioural index (0–3, see methods) was used to assay bilirubin effects on movement and wellbeing over a 24h period in mice. A) Plot of the behavioural index from the time of IP injection in vivo across a range of bilirubin doses (in presence of 300 mg/kg sulfadimethoxine). Filled black circles: 550mg/kg (n = 3) for 0-4h after injection; filled red circles: 450mg/kg (n = 5 for 0-6h and n = 24 24h); Filled grey circles: 200mg/kg (n = 3); Open triangles: Control 0mg/kg (n = 3) were injected with sulfadimethoxine, alone. B) The dose-response for bilirubin (75-550mg/kg) on the mouse behavior assayed using the Behavioural Index, 4h after bilirubin injection. The mean ± SEM (n = 3 to 5 animals) is fit to the Hill equation giving a half-maximal toxicity of 341±22 mg/kg. C) Hearing function across the same time-course as bilirubin exposure was assayed by measuring the ABR: control traces (before bilirubin exposure) are shown plotted against time and with increasing sound intensity from 44–94 dB SPL. Blue dashed lines mark the peak ABR waves I-II-III. D) IP injection of 450 mg/kg of bilirubin caused a near complete loss of the ABR E) which recovered after 24 h. F). The ABR thresholds were measured at 4h or 24h after bilirubin injection (control is injection of sulfadimethoxine alone) = 40.1 ± 1.0 dB SPL, n = 14; bilirubin 4h = 91.5 ± 2.5 dB SPL, n = 4; bilirubin 24h = 38.2 ± 1.5 dB SPL, n = 9, ANOVA followed by Bonferroni P<0.001. Note that only one animal was tested at 4 and 24h, the other 8 animals were tested only at 24h, see methods).

