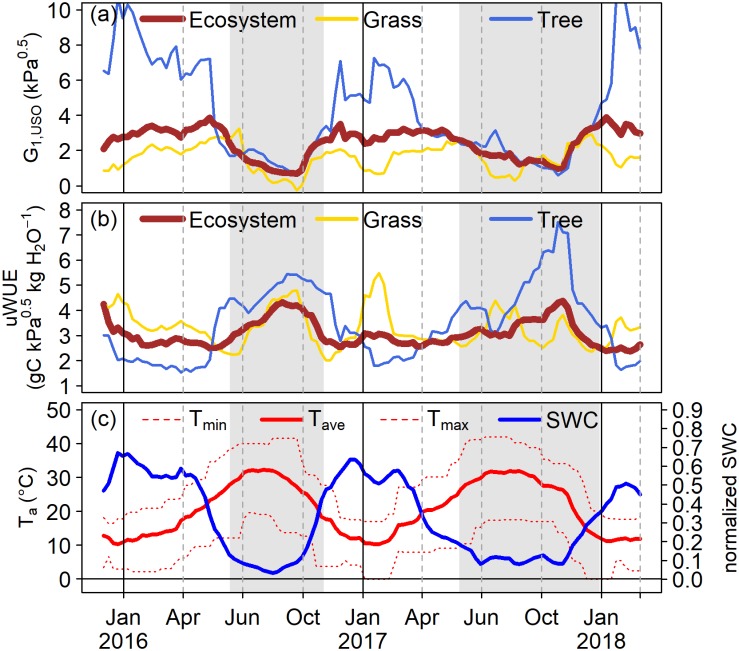
Fig 5.
(a) Time series of the stomatal slope parameter G1,USO and (b) underlying water-use efficiency (uWUE) calculated for the whole ecosystem (brown), the grass layer (yellow) and the trees (blue) between December 2015 and March 2018. (c) Time series of minimum, maximum and mean daily air temperature and normalized soil water content for the same period. Grey shaded areas denote dry periods associated with a wilted grass layer.

