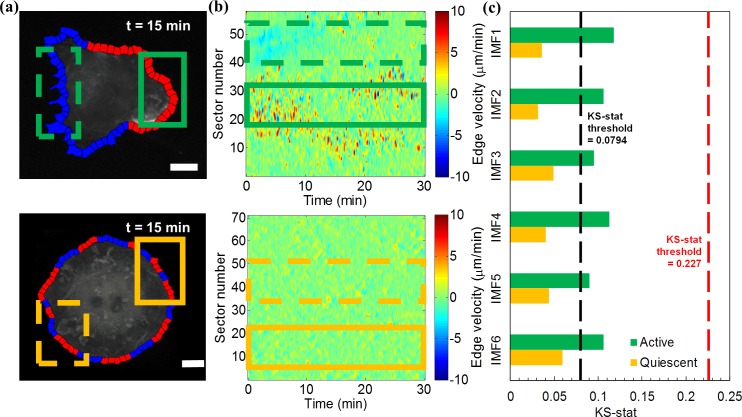
Fig 4. Polarity of spontaneously protruding Cos7 cells results in different spectral responses of subcellular regions.
(a) Snapshots of Cos7 cell protrusion at 15 min with red colored windows corresponding to higher motility (≥ 2μm/min) and blue colored windows corresponding to lower motility (< 2μm/min).See also Video 4 and 5. Scale bar = 20μm. Top: active, polarized cell; Bottom: quiescent cell. The solid green box in upper panel indicates the selected protruding cell front, and the dashed green box indicates the selected quiescent cell rear. The solid and dashed orange boxes in lower panel indicate the two subcellular regions of the quiescent Cos7 cell randomly selected for comparison. (b) Protrusion activity maps for active (top) and quiescent (bottom) cells. The solid/dashed green and yellow boxes indicate the time series selected for spectral analysis. (c) K-S test statistics comparing the instantaneous frequency distributions between the indicated subcellular regions. The threshold K-S statistics value of 0.0794 (black dash line) indicates the average difference between whole-cell distributions for a population of cells with homogeneous molecular make-up (mean value of K-S statistics heatmap Fig 2F). The threshold value of 0.227 (red dash line) indicates the average difference between whole-cell distributions of control and Vav2-inhibited cells.

