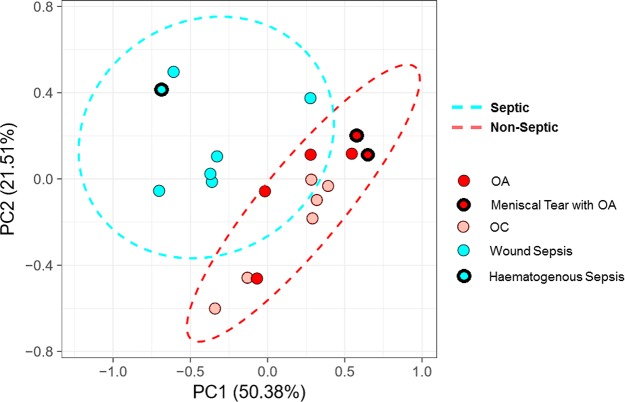
Figure 2.
Principal component analysis (PCA) scores plot of septic (blue) and nonseptic (red) SF samples. Samples with meniscal tear or hematogenous sepsis subdiagnoses for OA and sepsis, respectively, are highlighted in each group with a thick black outline, OC are distinguished from OA by highlight shade.

