
Figure 4. Monitoring in vivo DA release in transgenic zebrafish.
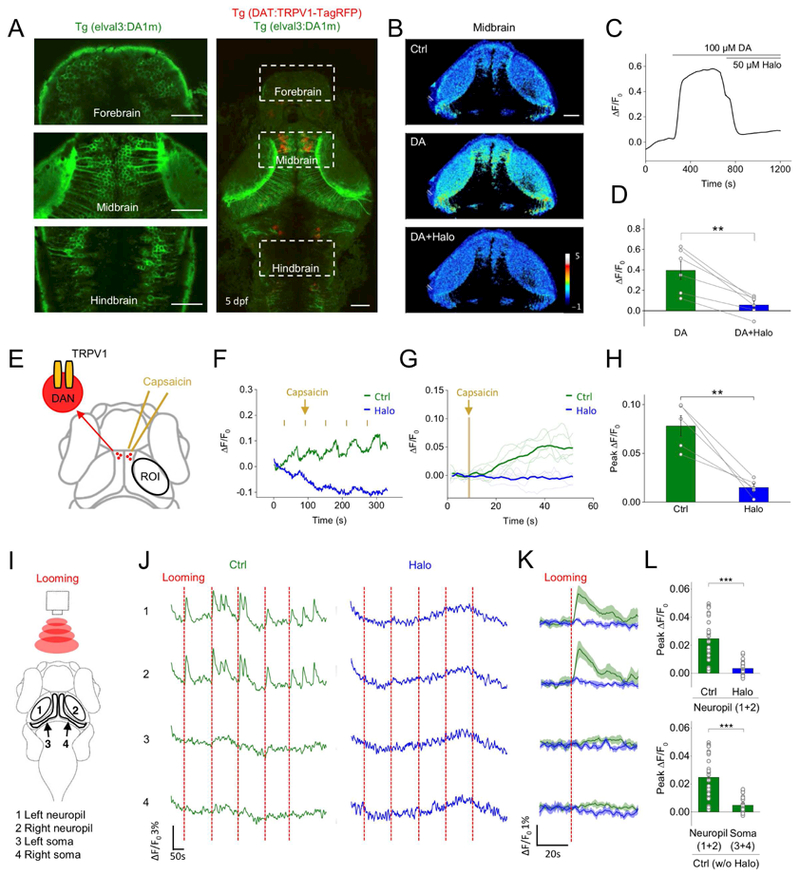
(A) Fluorescence images of a transgenic zebrafish larvae expressing DA1m (green) pan-neuronally and TRPV1-TagRFP (red) in DANs with expanded views of DA1m-expressing neurons in indicated brain regions (left).
(B-D) DA1m-expressing neurons to 100 μM DA followed by 50 μM Halo (n = 6 fishes; p = 0.002 between DA and DA+Halo). (B) Representative pseudocolor images, (C) traces and (D) group analysis.
(E) Schematic of chemogenetic activation of TRPV1-expressing DANs by capsaicin. The fluorescence signals in the tectal neurons (within ROI) were analyzed.
(F-H) Fluorescence changes of DA1m-expressing neurons to 5-trial capsaicin application, in control solution (green) or solution containing 50 μM Halo (blue). Representative traces encompassing 5 sequential stimulation trials and corresponding averaged traces from one fish are shown in F and G. (H) Group analysis (n = 5 fish; p = 0.006 between control and Halo).
(I) Schematic for visual stimulation in which red expanding dots were projected in front of the larva. The fluorescence responses in neuropil (1 and 2) and soma (3 and 4) regions of the optic tectum were analyzed, respectively.
(J-L) Fluorescence changes of DA1m-expressing neurons from each region during visual stimulation in control solution (green) or solution containing 50 μM Halo (blue). Vertical dashed red line, 3-s looming stimulation. Representative traces encompassing 5 sequential stimulation trials and the corresponding averaged traces from one fish are shown in J and K. Group analysis is shown in L (n = 30 trials from 3 fish for each condition; p < 0.001 in two panels).
Scale bars in (A) and (B), 50 μm.
Values with error bars indicate mean ± SEM.
Student’s t-test performed; **, p < 0.01; ***, p < 0.001.