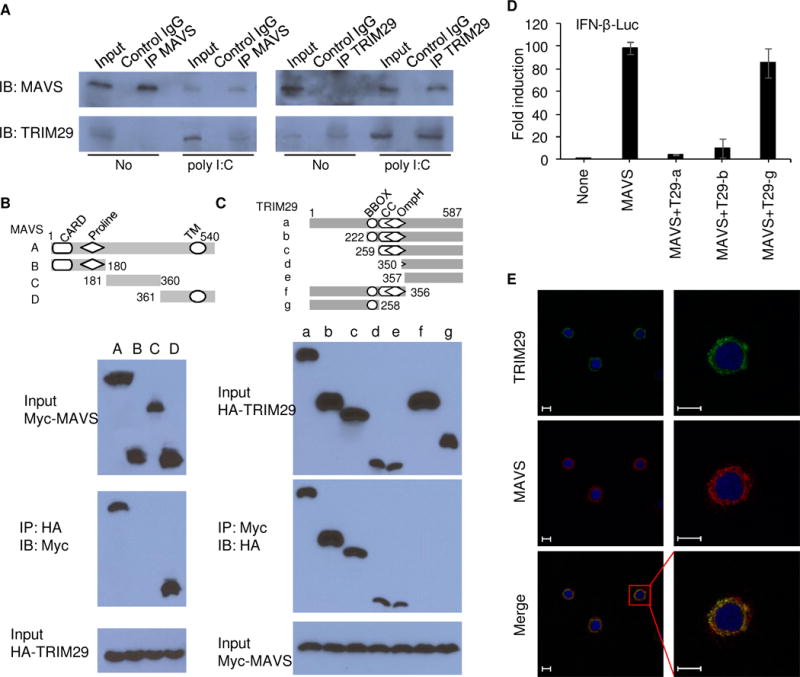
Figure 5. TRIM29 binds directly to MAVS.

(A) Immunoblot analysis of endogenous proteins of TRIM29 and MAVS precipitated with anti-MAVS, anti-TRIM29 or control immunoglobulin G (control IgG) from whole-cell lysates of BMDCs from wild type mice stimulated without (No) or with poly I:C (25 μg/ml) for 8h, and then with MG132 treatment for 3h. Input, 20% of the BMDCs lysate. (B) Full-length MAVS and serial truncations of MAVS with deletion of various domains (top). Below, immunoblot analysis of purified HA-tagged TRIM29 with anti-HA (bottom blot), and immunoblot analysis of purified Myc-tagged full-length MAVS and MAVS truncation mutants alone with anti-Myc (top blot) or after incubation with HA-tagged full-length TRIM29 and immunoprecipitation with anti-HA (middle blot). (C) Full-length TRIM29 and serial truncations of TRIM29 with deletion (Δ) of various domains (left margin); numbers at ends indicate amino acid positions (top). Below, immunoblot analysis of purified Myc-tagged MAVS with anti-Myc (bottom blot), and immunoblot analysis (with anti-HA) of purified HA-tagged full-length TRIM29 and TRIM29 truncation mutants alone (top blot) or after incubation with Myc-tagged MAVS and immunoprecipitation with anti-Myc (middle blot). (D) Activation of the IFN-β promoter in human HEK293T cells transfected with an IFN-β promoter luciferase reporter, plus expression vector (each 100 ng) for wild-type MAVS or expression vector for wild-type TRIM29 (T29-a) or TRIM29 mutants T29-b and T29-g; results are presented relative to those of renilla luciferase (cotransfected as an internal control). (E) Colocalization of endogenous TRIM29 and MAVS in BMDCs. Confocal microscopy of BMDCs infected with reovirus for 4h. MAVS was stained with Rabbit anti-MAVS polyclonal antibody (Cat: 14341-1-AP, proteintech), followed by Alexa Fluor 594 goat anti-rabbit secondary antibody (green), while TRIM29 was stained with mouse anti-TRIM29 monoclonal antibody (sc-166707, Santa Cruz), followed by Alexa Fluor 488 goat anti-mouse secondary antibody (red). DAPI served as the nuclei marker (blue). Scale bars represent 20 μm. Data are representative of three independent experiments.
