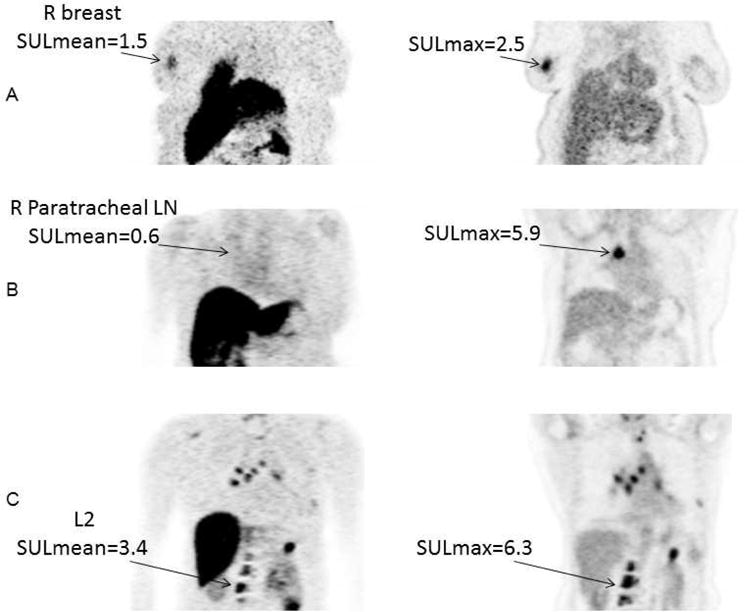
Figure 1.

Representative cases for the three classification groups. Coronal view from FES PET and FDG PET scans. Ordered subset expectation maximization (OSEM) reconstruction was used for improved presentation, but not for quantitation. A, Low FDG SULmax3. This 56—year—old woman had 4 lesions in her breast and lymph nodes (LN). Geometric mean FDG SULmax for the 3 hottest lesions was 1.5 (geometric mean FES SULmean was 1.1). She was on anastrozole for 5 months until progression. R, Right. B, High FDG SULmax3 and low FES SULmean3. This 59—year—old woman had 5 lesions in lymph nodes and spine. Geometric mean FDG SULmax for the 3 hottest lesions was 4.4. Geometric mean FES SULmean3 was 0.3. She was on tamoxifen for 3 months until progression. C, High FDG SULmax3 and high FES SULmean3. This 59—year—old woman had lesions in the breast, chest wall, and hilar nodes, as well as multiple bony lesions. Geometric mean FDG SULmax for the 3 hottest lesions was 12.7. Geometric mean FES SULmean was 6.6. She was on exemestane for 9.5 months until progression.
From Kurland BF, Peterson LM, Lee JH, et al. Estrogen Receptor Binding (18F-FES PET) and Glycolytic Activity (18F-FDG PET) Predict Progression-Free Survival on Endocrine Therapy in Patients with ER+ Breast Cancer. Clin Cancer Res. 2017;23:407–415; with permission.
