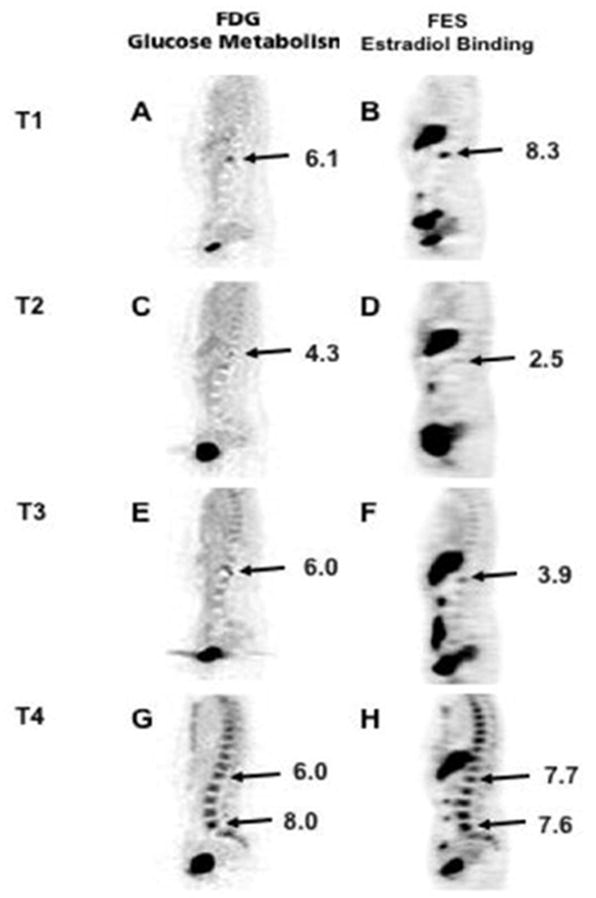
Figure 4.

FDG and FES PET images at four time points: T1: prior to initiation of endocrine therapy; T2: after response to endocrine therapy; T3: at subsequent disease progression on endocrine therapy; and T4: at disease progression on chemotherapy. This suggested an increase in the tumor’s capability to bind estradiol at the time of disease progression on chemotherapy, suggesting increased ER expression.
From Currin E, Peterson LM, Schubert EK, et al. Temporal Heterogeneity of Estrogen Receptor Expression in Bone-Dominant Breast Cancer: 18F-Fluoroestradiol PET Imaging Shows Return of ER Expression. J Natl Compr Canc Netw. 2016;14:144–147; with permission.
