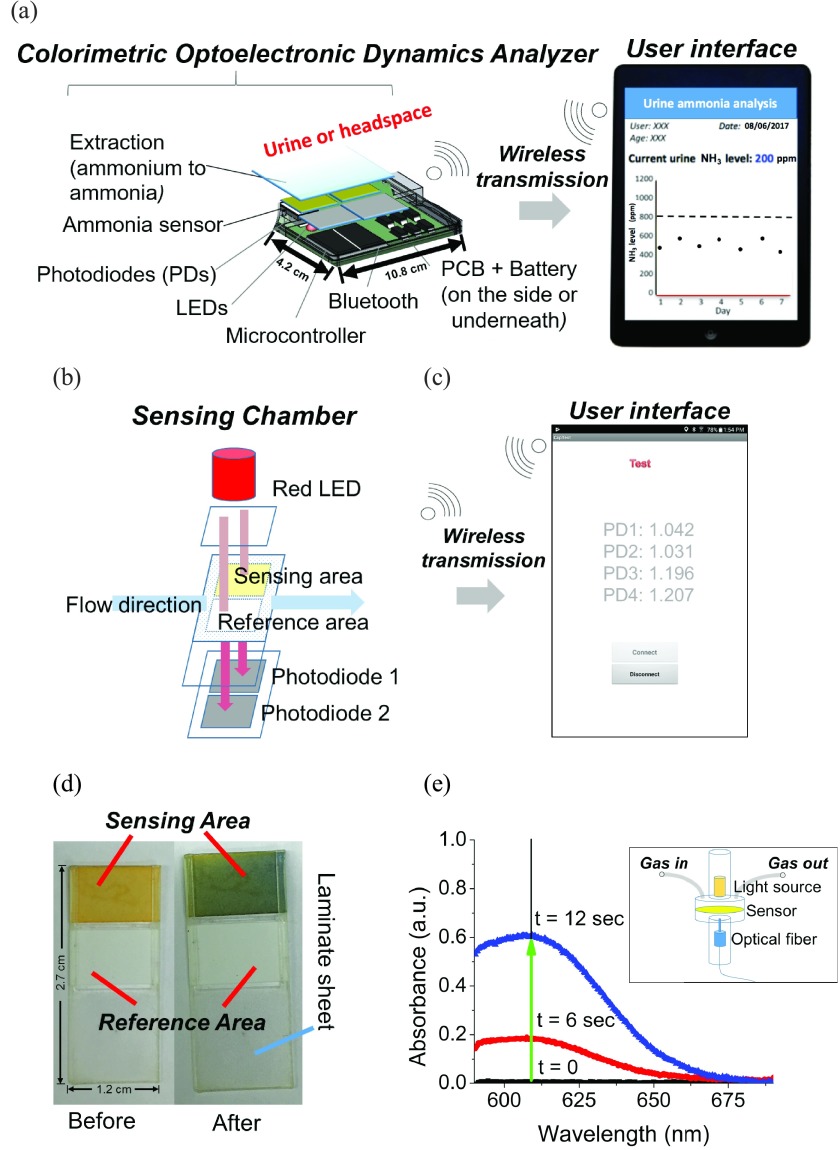
FIGURE 1.
The schematic of the Colorimetric Optoelectronic Dynamics Analyzer (CODA). (a) The main components of the CODA (real dimensions added). (b) Schematic of the sensing chamber, and (c) screenshot of the actual user interface, including photodiodes for measuring the signal of the sensing area and the reference area. By comparing the changes on the -log of signal ratio between the sensing and reference areas, the concentration of ammonia (NH3) gas can be determined via absorbance. CODA is able to measure total ammonia level in biological samples up to 59 mmol/L every 2 minutes. (d) The color change of the sensor from orange to blue after exposure to NH3. (e) Spectrum of the absorbance change of the sensor obtained with a JAZ Spectrophotometer (JS) instrument’s sensor chamber (illustrated in the insert). Spectrum before (t=0) and after (t>0) exposure to NH3, indicating the maximum absorbance change wavelength (609 nm) are shown. Insert: Schematic of JS’s sensing chamber. The optical fiber is on the top of the chamber, while the tungsten light source is at the bottom of the chamber. The gas travels from the left tube and discharges into ambient from the right tube.

