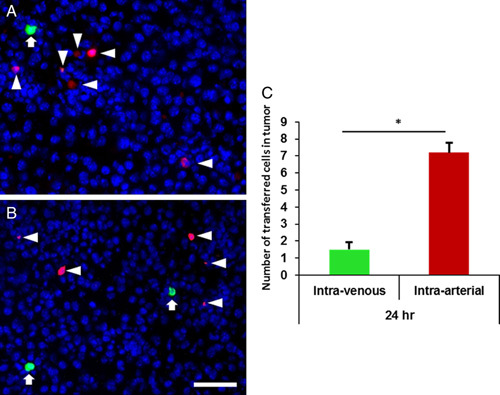
FIGURE 3.

A–C, Representative photomicrographs of immunofluorescence images of tumor tissue 24 hours after adoptive transfer with 1×10⁷ green CFSE-labeled cells IV (arrows) and 1×10⁷ orange CTO-labeled cells intra-arterial (arrow heads). DAPI-stained nuclei of endogenous cells within the tumor appear as blue background. CFSE indicates carboxyfluorescein succinimidyl ester; CTO, Cell Tracker Orang; DAPI, 4’,6-diamidino-2-phenylindole. *P<0.05.
