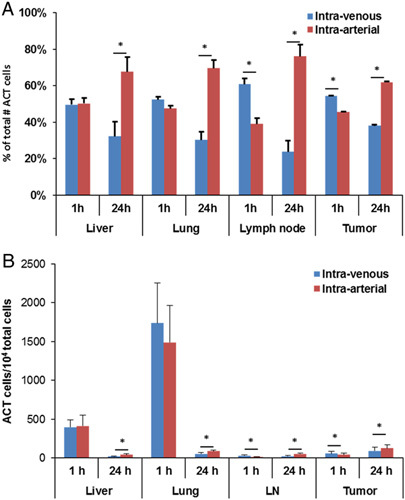
FIGURE 4.

Percentage of total adoptively transferred cells (A) and total number of adoptively transferred cell/104 total cells (B) identified by flow cytometry in various tissues after ACT. Intra-arterial injection resulted in increased tumor infiltration of T cells and lymph node accumulation at 24 hours (*P<0.05). ACT indicates adoptive cell transfer; LN, lymph node.
