FIGURE 3.

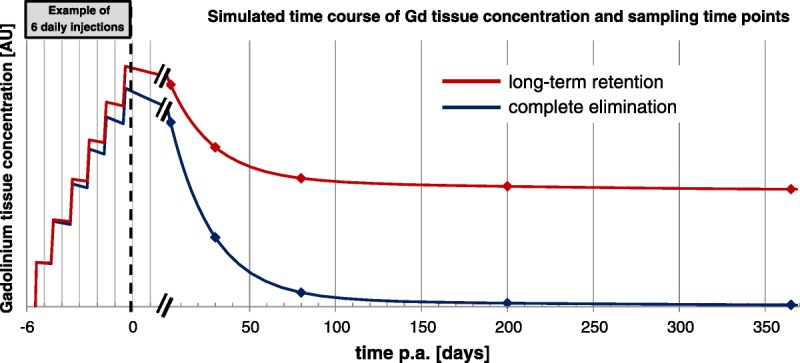
Schematic representation of elimination profiles in a long-term study. At the time of final administration, a sufficient number of sampling time points should be taken to evaluate the elimination rate.

Schematic representation of elimination profiles in a long-term study. At the time of final administration, a sufficient number of sampling time points should be taken to evaluate the elimination rate.