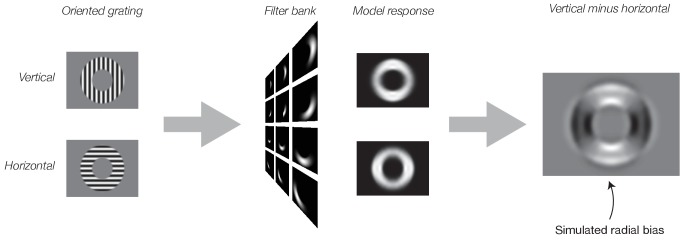
Figure 2. Simulated neural responses illustrating the impact of stimulus vignetting.
Oriented gratings were vignetted by inner and outer annuli, using stimulus parameters identical to those from Freeman et al. (2011). Next, the gratings were used as input to the model. Model responses were computed separately for vertical (top) and horizontal (bottom) gratings. Finally, model output was computed as the responses to vertical minus responses to horizontal gratings. Model exhibits a preference for horizontal gratings along the horizontal meridian and a preference for vertical gratings along the vertical meridian (i.e. a radial bias).

