. 2018 Jul 3;7:e36402. doi: 10.7554/eLife.36402

Figure 1. Structure of α-Syn(1-121) fibril.

(A) Schematic depicting the sequence of human α-Syn. The positions of the known familial mutations are indicated. β-strand regions are indicated by arrows colored from blue to red. (B) Cryo-EM micrograph depicting the distribution and general appearance of α-Syn fibrils. (C) Cryo-EM reconstruction of α-Syn(1-121) fibrils showing two protofilaments (orange and blue). (D) Cross-section of (C) illustrating the clear separation of the β-strands, also shown in Figure 1—figure supplement 3A and B. (E) Cross-section of a fibril (along the axis) illustrating the arrangement of the two protofilaments (orange and blue) and fitted atomic model. Positions of the initial (L38) and final (V95) residues fitted are indicated, as well as the initial and final residue of the NAC region (E61 to V95). Arrows indicate the location of four of the five α-Syn residues where familial mutations associated with PD occur. (F) Distribution of β-strands in a single protofilament of the α-Syn fibril, corresponding to residues 42 to 95. Color scheme, as in (A). (G) As in (F) but a perpendicular view to the fibril axis illustrating height differences in some areas of a single protofilament.

Figure 1.

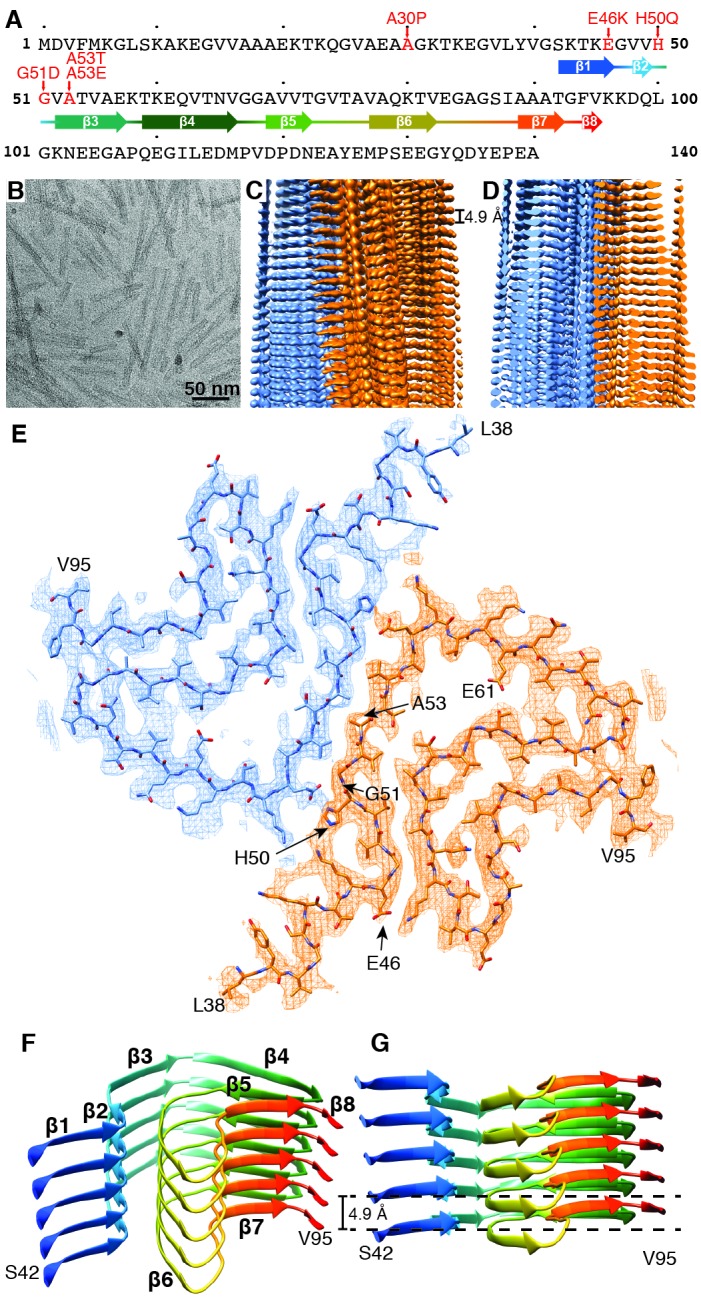
Figure 1—figure supplement 1. Negative stain TEM images of α-Syn strains.

Figure 1—figure supplement 1.

(A) Wildtype. (B) Ser129 Phosphorylated. (C) N-terminally acetylated. (D) C-terminally truncated (α-Syn(1-119)). (E) C-terminally truncated (α-Syn(1-121)). (F) C-terminally truncated (α-Syn(1-122)). 0.5 mg/ml fibril preparations were stained with 2% uranyl acetate. Scale bars: 100 nm.
Figure 1—figure supplement 2. Local resolution estimation and FSC curves.

Figure 1—figure supplement 2.

(A) Cryo-EM map with local resolution estimation; the color scale indicates resolution ranging from 3.0 Å to 4.6 Å. (B) Fourier shell correlation curve between two independently-refined half-maps, indicating an overall resolution of 3.4 Å. (C) Three examples of reference-free 2D class averages from the original dataset with their respective power spectra on the right. (D) 2D projections and power spectra of the 3D map. (E) 2D projections and power spectra of the atomic model. Arrows in power spectrum panels show the layer line at 1/ (4.9 Å) with peak intensities on both sides of the meridian (Bessel order n = 1), resulting from an approximate 21 screw symmetry between adjacent α-Syn subunits.
Figure 1—figure supplement 3. Details of atomic model and density.

Figure 1—figure supplement 3.

(A) (B) Clearly resolved separation of individual β-strands along the fibril. (C) Extra density at the interface of adjacent protofilaments between the positively charged lysines K43 and K45 and lysine K58. (D) Hydrophilic region surrounding a tunnel filled with an additional density. (E) Phosphorylation site S87 showing the location of this residue towards the outside of the fibril. (F) Distal loop of a protofilament indicating residues G68, A69 and G93, which may contribute to loop stability. (G) Arrangement of G47 and A78, which may contribute to the interaction between E46 and K80. (H) Interaction between H50 and E57 in the interface region of two protofilaments, which may contribute to the stability of protofilament interaction.