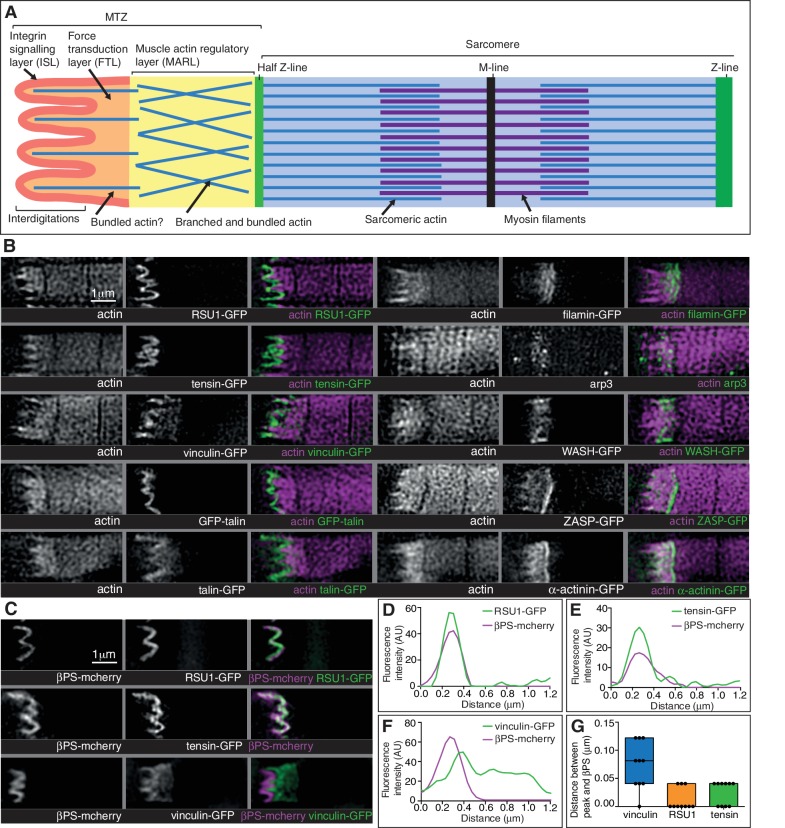
Figure 5. Super-resolution microscopy resolves distinct zones in the MTZ.
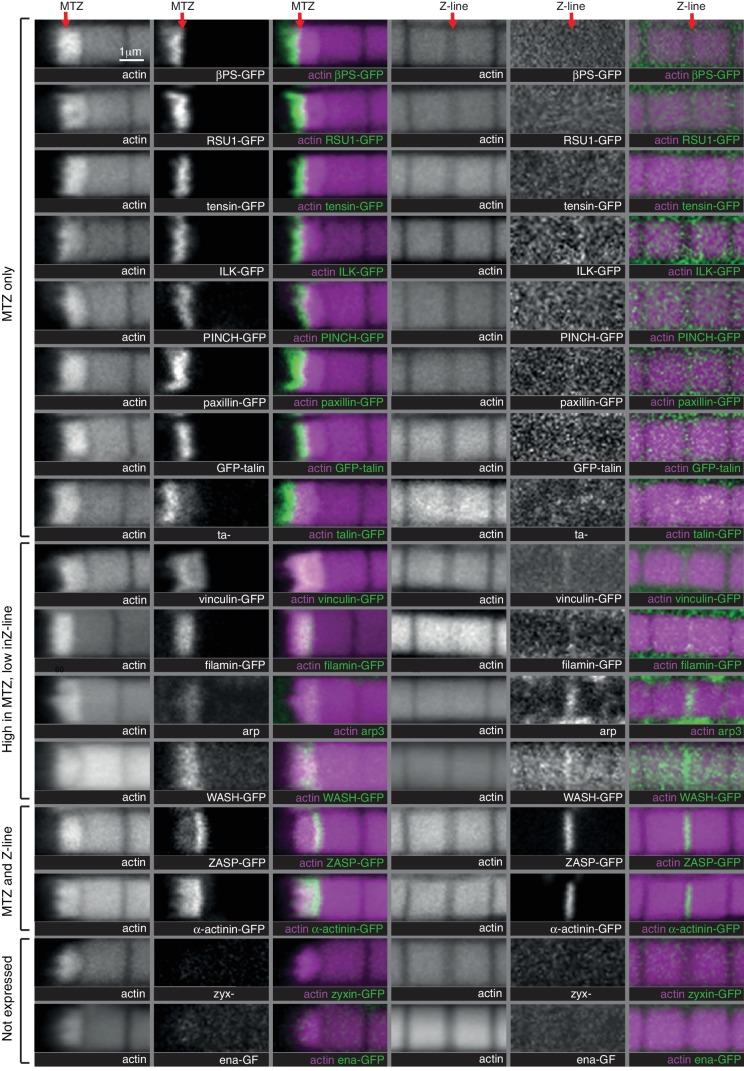
(A) Schematic of the four zones within the MTZ: (1) an integrin signalling layer (ISL, red) at the membrane; and then zones containing different actin structures-(2) a force transduction layer (FTL, orange); (3) a muscle actin regulatory layer (MARL, yellow); and (4) the first (half) Z-line (green) followed by the first sarcomere (blue). (B) SIM images of wild type myofibrils expressing IAPs tagged with GFP as indicated, or using antibody staining for arp3 (white and green), and stained for F-actin (white and magenta). Note the four zones: (1) the ISL containing tight membrane localization of RSU1, tensin, and GFP-talin tagged at the N-terminus and very little F-actin; (2) both ISL and FTL for vinculin and talin tagged toward the C-terminus; (3) the MARL containing filamin, vinculin, arp3 and WASH; (4) the first Z-line containing high levels of ZASP and α-actinin. Note that the web-like appearance of actin in the SIM images is an artefact of the SIM technique. See also Figure 5—figure supplement 1. (C–F) RSU1 and tensin overlap with integrin, in the ISL, whereas vinculin is separate, within the FTL. (C) SIM images of wild type myofibrils expressing pairs of proteins as indicated. (D–F) Representative line graphs, from images as in B, showing fluorescence intensity over distance. (G) Quantitation of the distance between the peaks of fluorescent intensity of βPS-mcherry versus RSU1-GFP, tensin-GFP or vinculin-GFP, combined from measurements of 10 myofibrils each. Boxplots show median, interquartile range, minimum and maximum.


