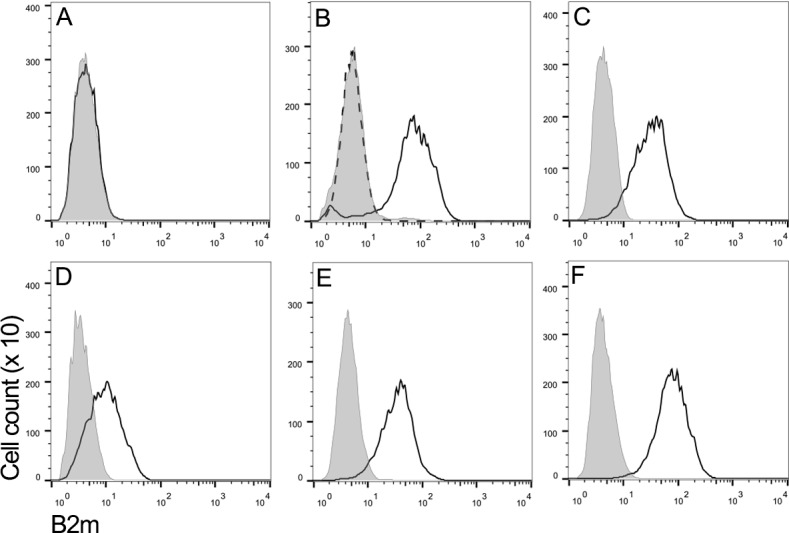
Figure 1. DFT2 cells express β2m in vitro.

Flow cytometry to compare β2m expression shows (A) DFT1_4906, (B) DFT1_4906 + IFNγ, (C) DFT2_RV, (D) DFT2_SN, (E) DFT2_TD549 and (F) Fibroblast_Salem cells stained with α-β2m (solid line) and secondary only control (shaded peak). DFT1_4906 + IFNγ (B) stained with blocked α-β2m antibody is also shown (dashed line). Fluorescence intensity for α-β2m on x-axis and cell counts on y-axis.
