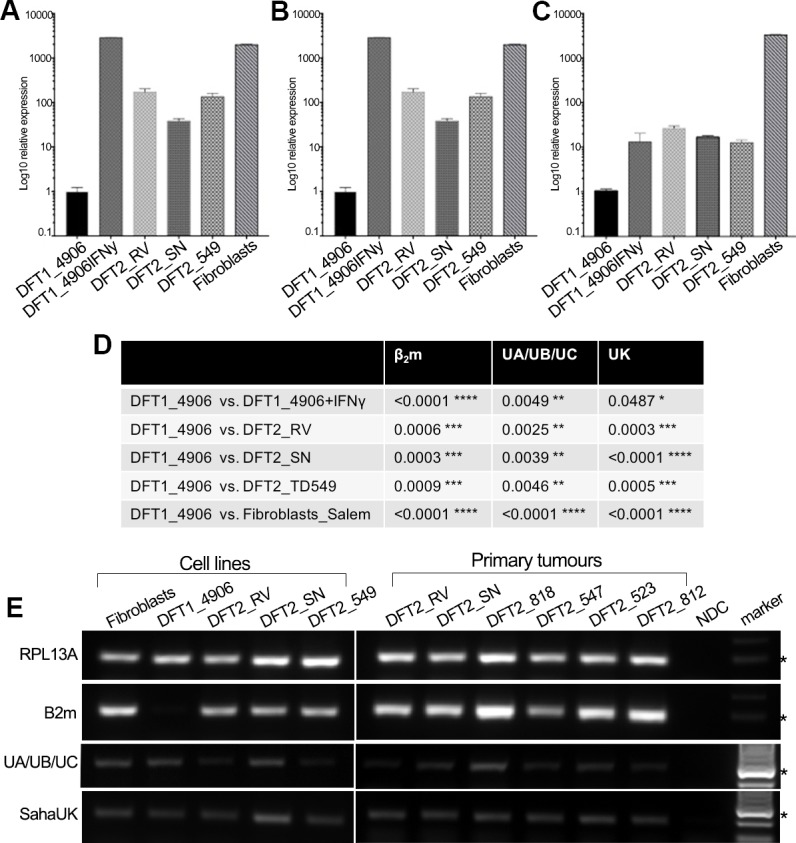
Figure 2. DFT2 cells in vitro and in vivo express mRNA for β2m, Saha-UK, Saha-UA, UB and UC.
RT-qPCR of (A) β2m, (B) Saha-UA, -UB and -UC and (C) Saha-UK mRNA expression by DFT2 cell lines (DFT2_RV, DFT2_SN, DFT2_TD549), fibroblast cells (Fibroblasts_Salem) and DFT1 cells treated with IFNγ (DFT1_4906 + IFNγ) relative to DFT1_4906 cells. Gene expression levels are normalized against RPL13A as a housekeeping gene. Data are represented as mean ± S.E.M of three technical replicates. (D) An unpaired T-test was performed to test for statistical significance. (E) RT-PCR on DFT2 cell lines and DFT2 primary tumours for β2m, Saha-UA, -UB and -UC and Saha-UK. RPL13A was used as a loading control. A no DNA control (NDC) is included for each RT-PCR. A marker at 300 base pairs is indicated by an asterisk.

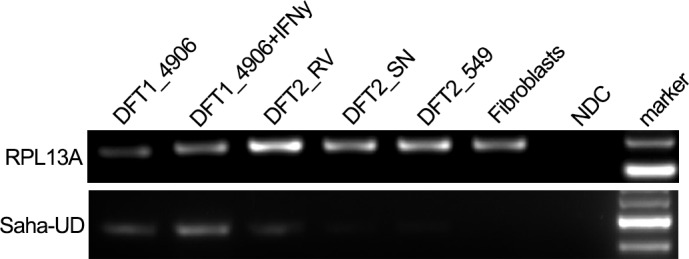
Figure 2—figure supplement 1. RT-PCR amplification of RPL13A and Saha-UD from DFT1, DFT2 and Fibroblast cells.

