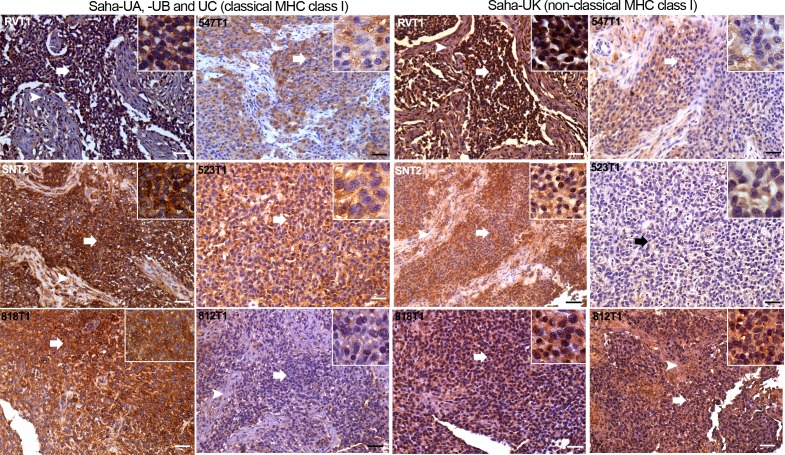
Figure 3. DFT2 tumours express variable levels of classical MHC class I (Saha-UA, -UB and -UC) and non-classical MHC class I (Saha-UK) in vivo.
IHC staining of DFT2 tumours (DFT2_RVT1, DFT2_SNT2, DFT2_818T1, DFT2_547T1, DFT2_523 DFT2_812) with α-UA/UB/UC_15-25-18 against Saha-UA, -UB and -UC and α-UK_15-29-1 against Saha-UK. Arrows indicate tumour cells for each biopsy; arrow heads indicate stroma separating nests of tumour cells where present. Isotype and secondary antibody controls can be found in Figure 3—figure supplement 2. Boxed insets are at 600 x magnification and are taken from areas indicated by arrows. Scale bars represent 50 μm. Positive cells for each marker are stained brown, nuclei are stained blue.
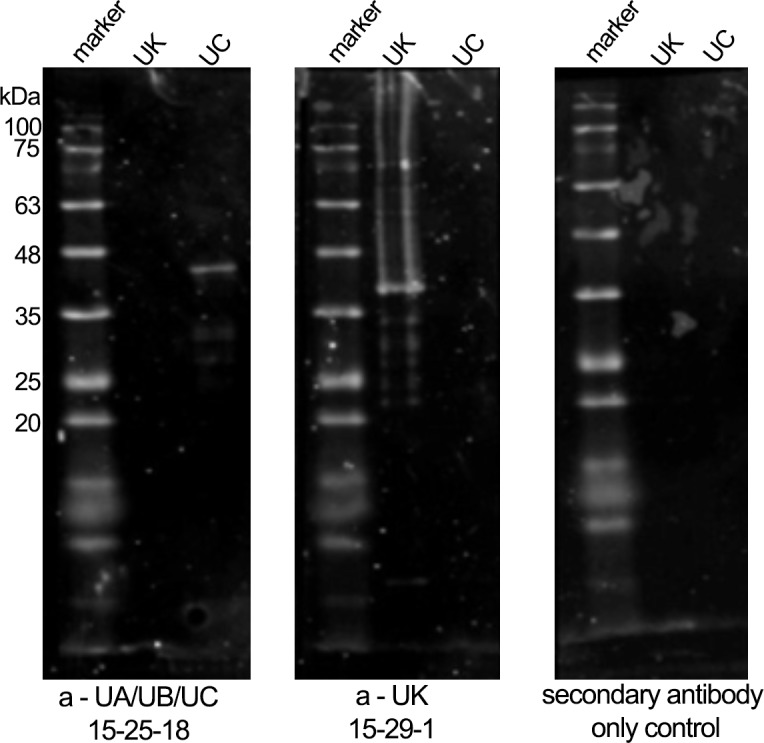
Figure 3—figure supplement 1. Western blots illustrating specificity of the MHC class I heavy-chain monoclonal antibodies.

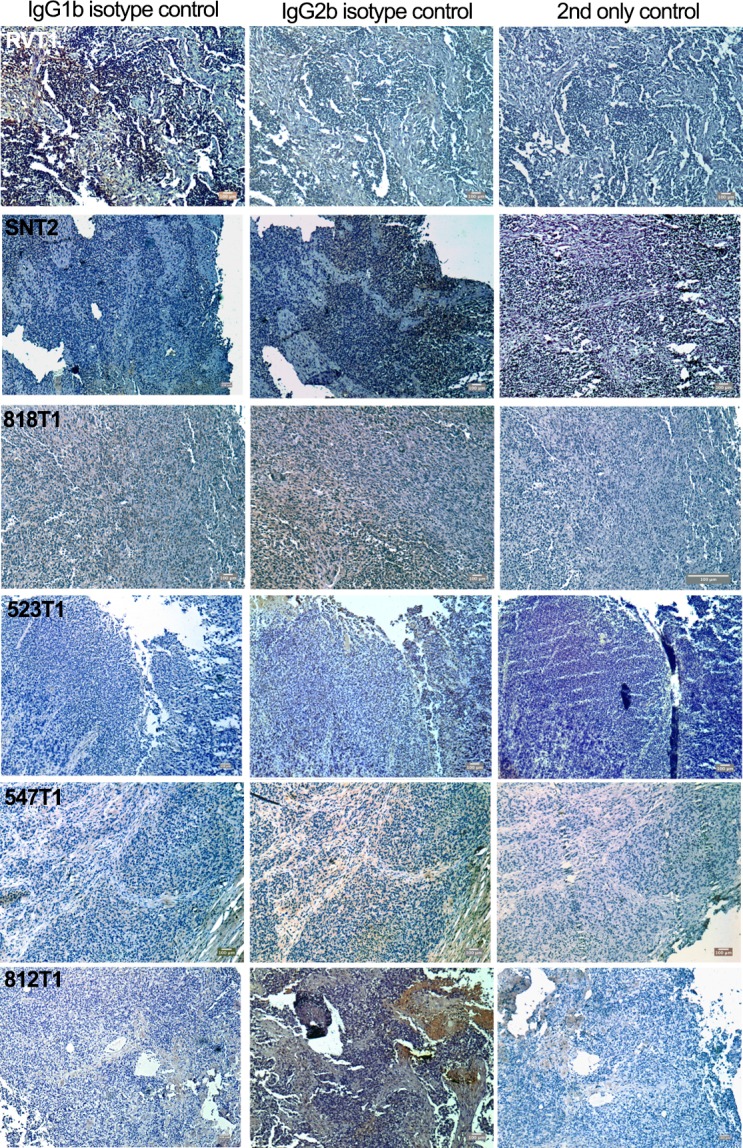
Figure 3—figure supplement 2. Isotype controls (IgG1b – anti-SahaUA/UB/UC and IgG2b – anti-SahaUK) and secondary antibody only controls for the immunohistochemistry presented in Figure 3.


