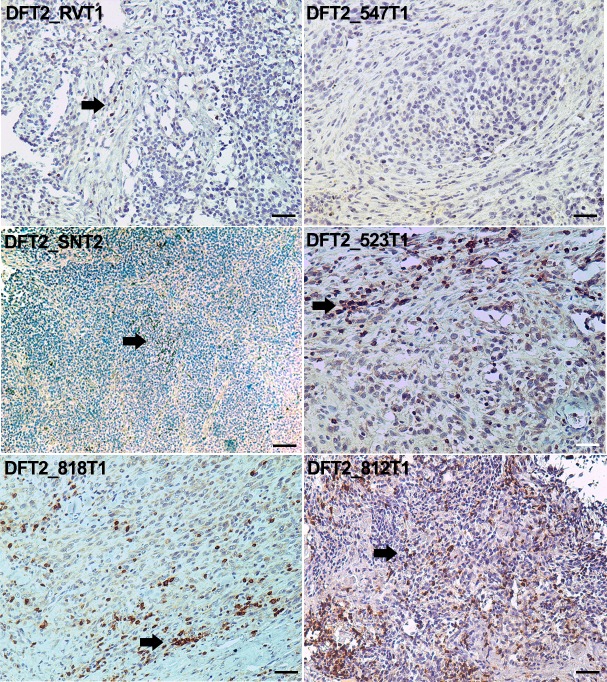
Figure 4. CD3 staining of DFT2 tumours.
CD3 staining of DFT2_RVT1, DFT2_SNT2 DFT2_818T1, DFT2_TD547T1, DFT2_523T2 and DFT2_812 tumours. CD3 positive cells are indicated by arrows. DFT2_SNT2, and DFT2_547 are CD3 negative. Scale bars represent 50 μm. Positive cells for each marker are stained brown, nuclei are stained blue.

