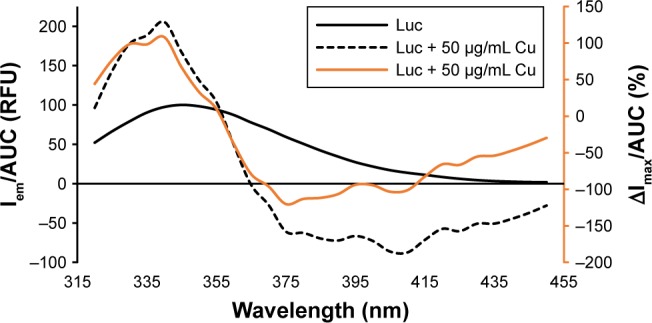
Figure 1.

2-D FDS spectrum of Luc alone and Luc in the presence of Cu NPs at 25°C in 0.01 M PBS (pH 7.8). The y axis represents Iem/AUC in relative absorbance units RFU or the change in ΔImax/AUC (%). The x axis represents emission wavelength (315–455 nm) (λex = 295 nm). The data are tabulated in Table 2 for all NPs at 50 µg/mL NP. The black line represents Iem/AUC (corresponding to the black axis) and the orange line represents ΔImax/AUC (%) (corresponding to the orange axis).
Abbreviations: 2-D FDS, 2-dimensional fluorescence difference spectroscopy; Luc, luciferase; NPs, nanoparticles; AUC, area under the curve; RFU, relative fluorescence units.
