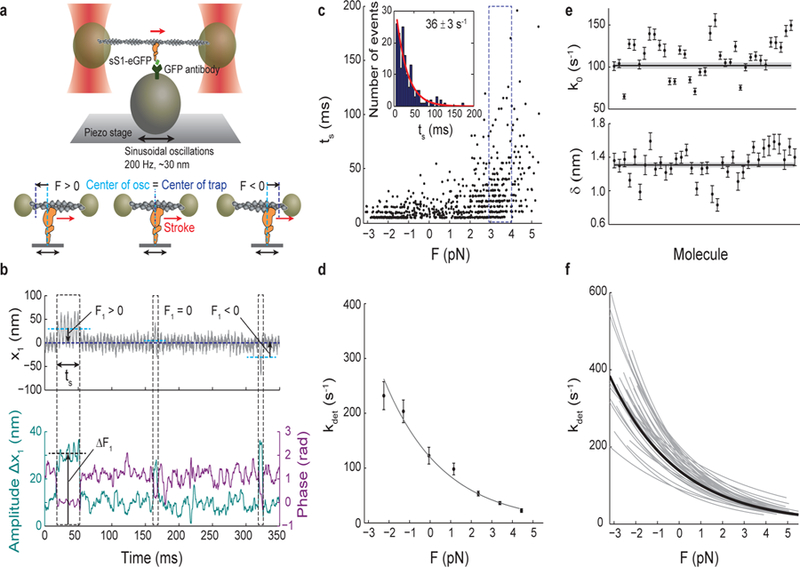
Figure 1: Load-dependent kinetics of single molecules of human β-cardiac myosin measured by harmonic force spectroscopy (HFS).

a, Oscillations of the piezo stage on which myosin is attached in the three-bead optical trap system (top) apply a sinusoidal load (force) to myosin upon attachment to actin (bottom). b, Example trace of the position of one trapped bead, x1 (top). An increase in the amplitude of oscillation and a simultaneous decrease in the phase between the trapped bead and piezo stage (bottom) are the two criteria used in the automated detection of an event. Over the course of many individual events, a range of forces with mean F1 (calculated as x1 multiplied by the trap stiffness) is automatically applied as myosin attaches randomly along actin to experience both positive (resistive) or negative (assistive) loads 11. Three events are outlined: F1 > 0, F1 ~ 0, and F1 < 0. Each event experiences the oscillatory force with mean F1 and amplitude ΔF1, calculated as the amplitude Δx1 multiplied by the trap stiffness. Force F in Eqn. 1 is calculated as the sum of F1 and F2 from the second trapped bead, and the force amplitude ΔF is calculated as the sum of ΔF1 and ΔF2 (~3–4 pN). c, All events (N=729) for one example molecule. Duration of event (ts) is plotted against force. Events binned by force (dashed outline) have exponentially-distributed binding times from which the detachment rate at that force is determined by maximum likelihood estimation (MLE) (inset). The error on the rate is calculated from the variance of the MLE as the inverse Fisher information. d, The Arrhenius equation with harmonic force correction (Eqn. 1) is fitted to the detachment rates at each force to yield the load-dependent kinetics curve for one molecule. For this molecule, k0 = 84 ± 4 s−1, the rate at zero load, and 𝛿 = 1.31 ± 0.03 nm, the distance to the transition state, which is a measure of force sensitivity. Errors on k0 and 𝛿 are from the covariance matrix (inverse Fisher information matrix) for the parameters. e, k0 and 𝛿 for all molecules measured (N=36). Their weighted means, k0 = 102 ± 4 s−1, 𝛿 = 1.31 ± 0.03 nm, are shown as horizontal lines with s.e.m. in gray. f, Load-dependent kinetics curves for all molecules measured (gray), each described by a (k0, 𝛿) pair in (e). Individual data points as in (d) are not shown for clarity. The curve corresponding to the weighted means of k0 and 𝛿 is shown in black. All experiments were done at saturating (2 mM) ATP.
