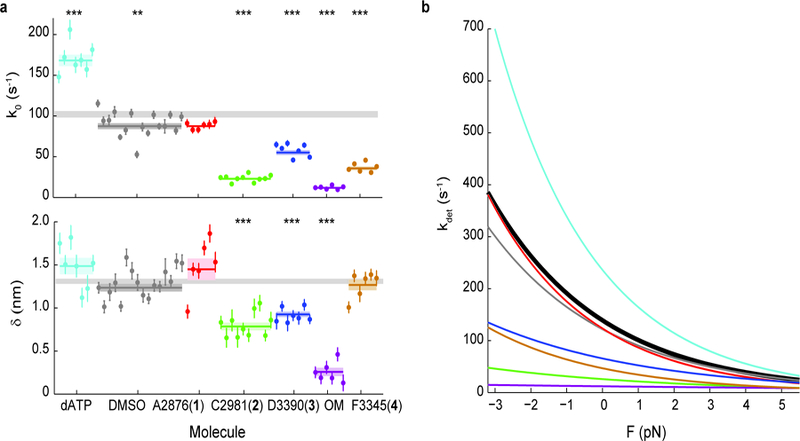
Figure 3: Effects of small molecule compounds on the load-dependent kinetics of single molecules of β-cardiac myosin.

a, k0 and 𝛿 for all molecules measured. Note that some molecules have error bars smaller than the displayed data point. Weighted means ± s.e.m. are shown as horizontal lines and shaded areas, with those of untreated myosin shown as gray bars (replicated from Fig. 1) across the plots. In the case of 2-deoxy-ATP (dATP), 2 mM dATP was used in place of ATP. All other conditions used 2 mM ATP, 2% DMSO, and 25 µM compound concentration. 2-tailed unequal variances t-test was performed on dATP vs ATP, DMSO vs WT, and compounds vs DMSO. **p<0.001, ***p<0.0001. For detailed values, see Table 1 and Supplementary Table 1. b, The exponential dependence of detachment rate kdet on force for every compound. Curves correspond to the weighted means of k0 and 𝛿 (see Supplementary Figs. 2, 3, and 4 for curves of individual molecules). Myosin without treatment is shown in black.
