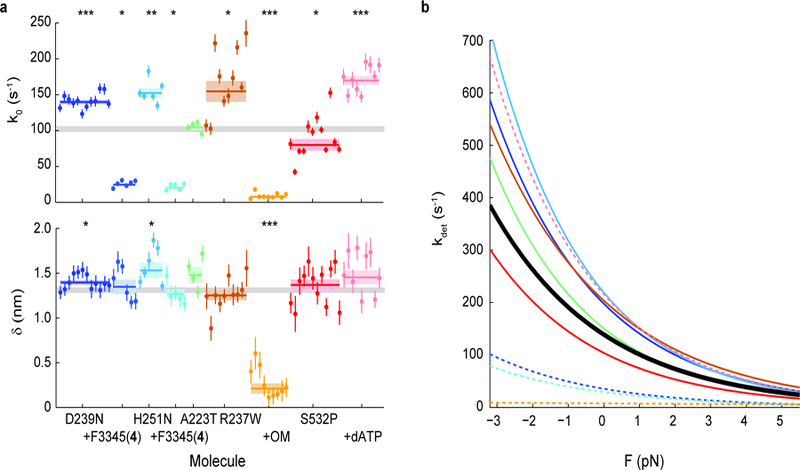
Figure 4: Effects of cardiomyopathy-causing mutations on the load-dependent kinetics of single molecules of β-cardiac myosin, and their reversal by small molecule compounds.

a, k0 and 𝛿 for all molecules measured. Note that some molecules have error bars smaller than the displayed data point. Weighted means ± s.e.m. are shown as horizontal lines and shaded areas, with those of untreated WT myosin shown as gray bars (replicated from Fig. 1) across the plots. Addition of allosteric compounds (F3345(4) to D239N and H251N; OM to R237W) were in presence of 2% DMSO. 2-tailed unequal variances t-test was performed on mutants vs WT and mutants + compounds + DMSO vs mutants + DMSO, or S532P + ATP vs S532P + dATP. *p<0.05, **p<0.001, ***p<0.0001. For detailed values, see Table 1 and Supplementary Table 1. b, The exponential dependence of detachment rate kdet on force for every mutant. Curves correspond to the weighted means of k0 and 𝛿 (see Supplementary Figs. 3 and 5 for curves of individual molecules). WT is shown in black. Dashed lines are mutants with treatment.
