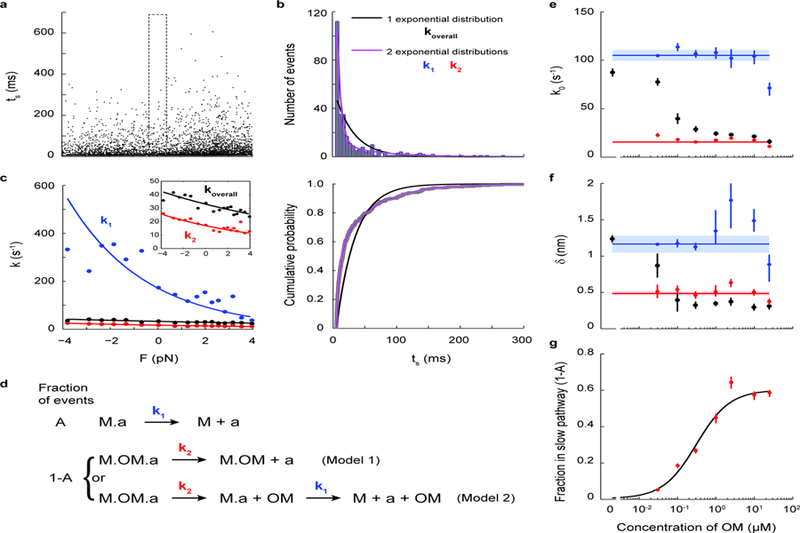
Figure 5: Dosage analysis of OM’s effect on the load-dependent detachment kinetics of single molecules of β-cardiac myosin.

a, Lifetimes of all events (N=5424) from 7 myosin molecules measured at 300 nM OM. b, Within each force bin (the F=0 force bin is shown, as outlined in a), the binding times follow a double exponential distribution (purple) in which the fast k1 and slow k2 rates describe the kinetics of steps illustrated in d. The comparison between single vs. double exponential fits are shown as distribution (top) and cumulative probability (bottom). c, Rate as a function of force (Eqn. 1) as determined from all events of the 300 nM OM dataset. The overall rate (black) was obtained by fitting a single exponential distribution. When the double exponential distribution is used, the two fitted rates k1 (blue) and k2 (red) each follow Eqn. 1. The curves were obtained from a MLE on all events without binning by force. Independently, the rates at each force were obtained by a MLE on events binned by force (as in b) and plotted as data points. Inset shows a zoomed-in view. See Methods for details. d, Kinetic models of OM’s action on single myosin molecules. The fraction A of events in which OM is not bound to myosin (“M”) undergo detachment from actin (“a”) at rate k1, the load-dependent detachment rate of myosin as measured earlier in this work (top). In the fraction 1-A of events in which OM is bound to myosin, either OM-bound myosin detaches from actin at rate k2 (Model 1), or myosin releases OM first at rate k1 and then detaches from actin at rate k1 (Model 2). e-f, k0 and 𝛿 at different concentrations of OM for the overall detachment (black) and its fast (blue) and slow (red) components, obtained by MLE on all events from 6–9 molecules for each concentration of OM (as in c). Weighted means ± s.e.m. are shown as horizontal lines and shaded areas. Their values are: k01 = 105 ± 6 s−1, 𝛿1 = 1.2 ± 0.1 nm, k02 = 16 ± 1 s−1, 𝛿2 = 0.48 ± 0.03 nm. g, The fraction 1-A of events with OM bound at different concentrations of OM. A fit to the Michaelis-Menton equation gives an apparent Kd = 0.31 ± 0.05 µM and max(1-A) = 0.60 ± 0.03. Individual error bars in e-g are the 68% confidence interval from bootstrapping 1000 iterations.
