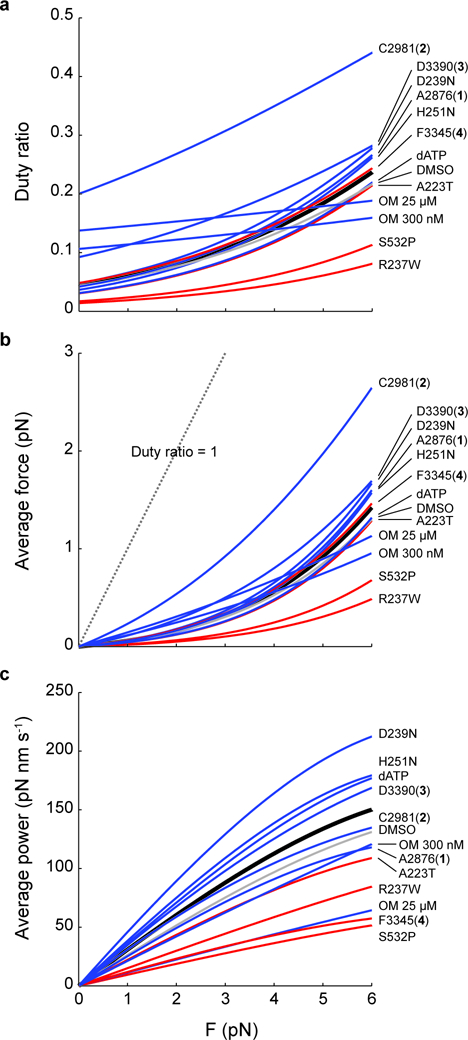
Figure 7: The effects of small molecule compounds and cardiomyopathy-causing mutations on the power produced by single molecules of β-cardiac myosin.

a, Duty ratio, b, average force, and c, average power as a function of the load force F, calculated by Eqns. 2–5. All curves are calculated using values of detachment rate kinetics (k0, 𝛿), kcat, and kattach given in Table 1. Black: WT. Gray: DMSO. Blue: HCM or activators. Red: DCM or inhibitor.
