
Fig. 1. BRD4 and MED1 form puncta at super-enhancers.
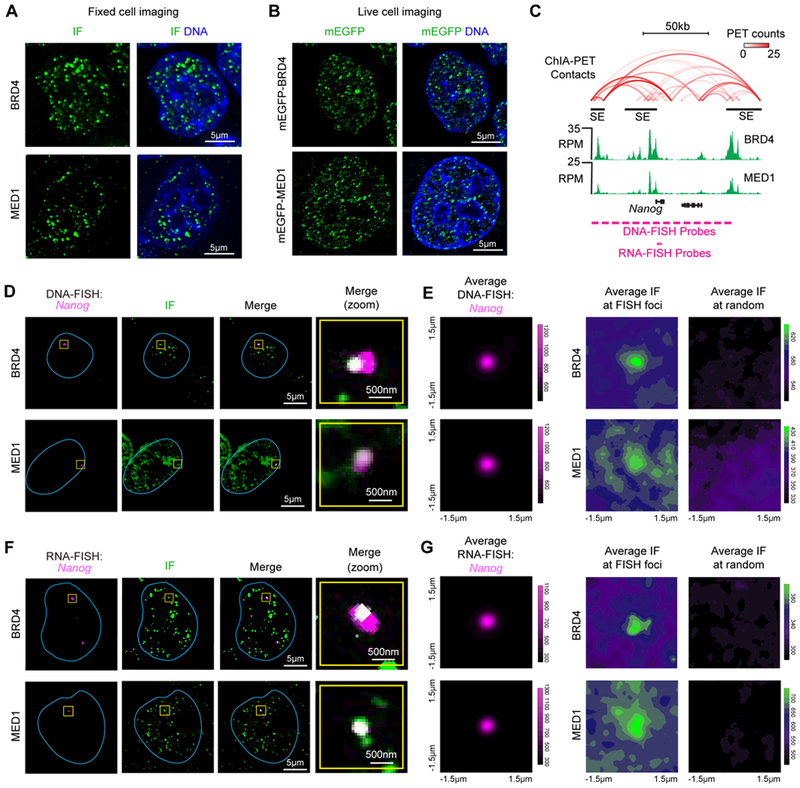
(A) Immunofluorescence (IF) imaging of BRD4 and MED1 in mouse embryonic stem cells (mESC). Fluorescence signal is shown alone (left) and merged with Hoechst stain (right). (B) Live imaging of endogenously-tagged mEGFP-BRD4 and mEGFP-MED1 in mESC. (C) Depiction of Nanog locus, associated super-enhancers (black bars), DNA contacts (red arcs), BRD4 and MED1 ChIP-seq (green histograms), and location of FISH probes. (D) Co-localization between BRD4 or MED1 and the Nanog locus by IF and DNA-FISH in fixed mESC. Separate images of the indicated IF and FISH are shown, along with an image showing the merged channels (overlapping signal in white). The blue line highlights nuclear periphery, determined by Hoechst staining (not shown). The “Merge (zoom)” column displays region of image (yellow box) zoomed in for greater detail. (E) Averaged signal of either FISH, IF for BRD4, or IF for MED1 centered at Nanog DNA-FISH foci or randomly selected nuclear positions. (F) Co-localization between BRD4 or MED1 and the nascent RNA of Nanog by IF and RNA-FISH in fixed mESC. Data shown as in (D). (G) Averaged signal of either FISH, IF for BRD4, or IF for MED1 centered at Nanog RNA-FISH foci or randomly selected nuclear positions.