
Fig. 3. 1,6-hexanediol disrupts BRD4 and MED1 puncta and disrupts BRD4, MED1, and RNAPII occupancy at super-enhancers and super-enhancer driven genes.
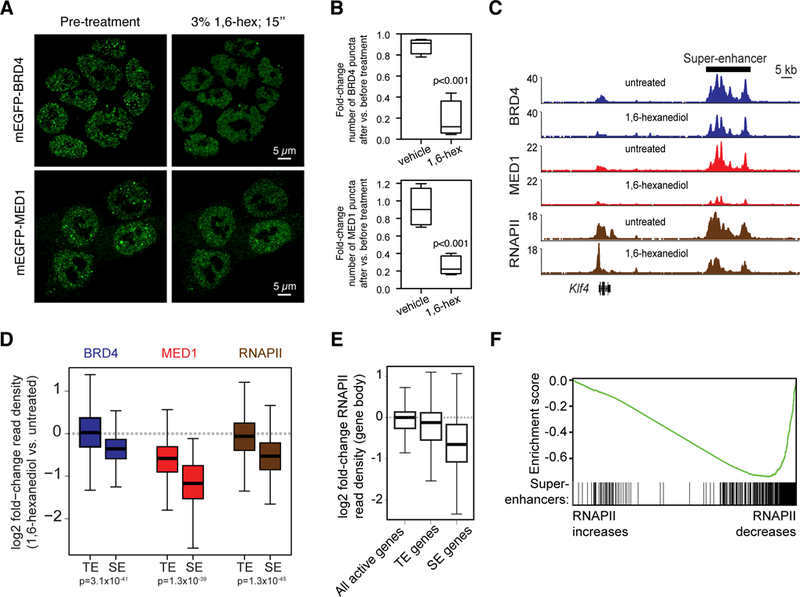
(A) Representative images of mEGFP-BRD4 or mEGP-MED1 engineered mESCs before and after treatment with 3% hexanediol for 15 seconds. (B) Box plot presentation of the fold change in number of mEGFP-BRD4 or mEGFP-MED1 puncta observed before and after addition of vehicle or 1,6-hexanediol to a final concentration of 3%. (C) Genome browser view of BRD4 (blue), MED1 (red), and RNAPII (brown) ChIP-seq data from untreated or 1,6-hexanediol treated (1.5% for 30 minutes) mESCs at the Klf4 locus. (D) Box plot representation of log2 fold-change in BRD4 (blue), MED1 (red), and RNAPII (brown) ChIP-seq read density (1,6-hexanediol versus untreated) for regions defined as super-enhancers (SEs) or typical enhancers (TEs) (see methods and Table S2). (E) Boxplot representation of log2 fold-change in RNAPII ChIP-seq density (1,6-hexanediol versus untreated) within the gene body (transcription start site to transcription end site) of all active genes (RPKM>1), typical-enhancer associated genes (TE genes) or super-enhancer associated genes (SE genes). (F) Gene Set Enrichment Analysis of genes, ranked by their log2 fold-change in RNAPII ChIP-seq density within the gene body and annotated against the set of super-enhancer-associated genes. Enrichment score profile and position of SE-associated genes is shown.