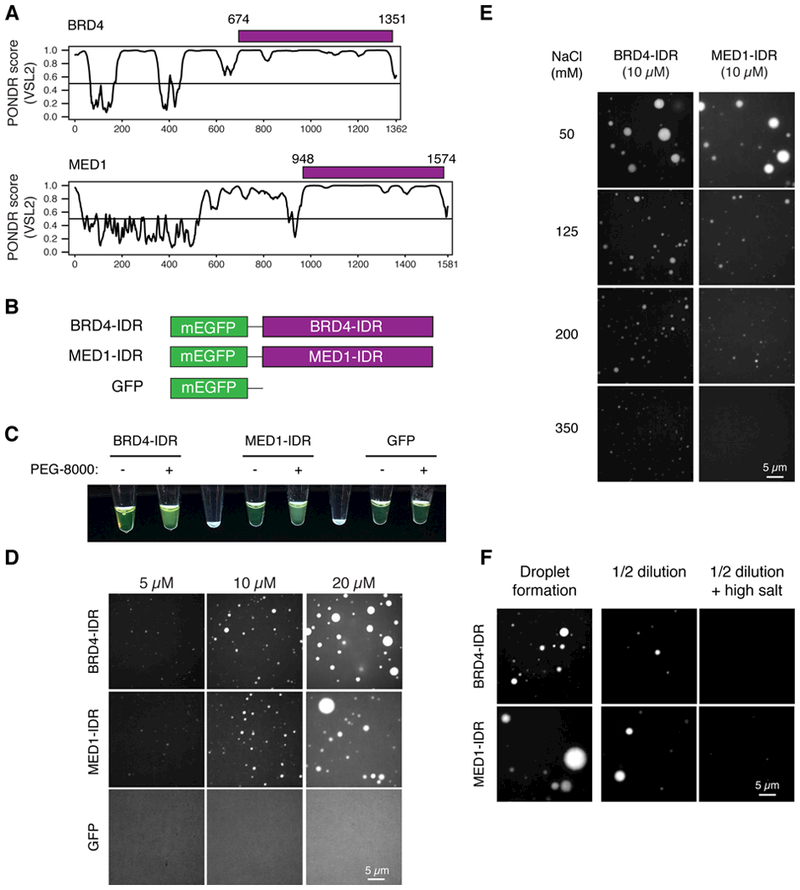
Fig. 4. Intrinsically disordered regions (IDRs) of BRD4 and MED1 phase separate in vitro.

(A) Graphs plotting intrinsic disorder (PONDR VSL2) for BRD4 and MED1. PONDR VSL2 score (y-axis) and amino acid position (x-axis) are shown. Purple bar designates the IDR under investigation. (B) Schematic of recombinant mEGFP fusion proteins used here. Purple boxes indicate IDR’s of BRD4 (BRD4-IDR) and MED1 (MED1-IDR) shown in (A). (C) Visualization of turbidity associated with droplet formation. Tubes containing BRD4-IDR (left pair), MED1-IDR (middle pair) or GFP (right pair) in the presence (+) or absence (−) of PEG-8000 are shown. Blank tubes included between pairs for contrast. (D) Representative images of droplet formation at different protein concentrations. BRD4-IDR, MED1-IDR or mEGFP were added to droplet formation buffer to final concentrations indicated. (E) Representative images of droplet formation at different salt concentrations. BRD4-IDR or MED1-IDR was added to droplet formation buffer to achieve 10 μM protein concentration with a final NaCl concentration as indicated. (F) Representative images of droplet reversibility experiment. BRD4-IDR (top row) or MED1-IDR (bottom row) BRD4-IDR or MED1-IDR, as indicated, (20 μM protein, 75 mM NaCl) (initial) or followed by a 1:1 dilution (diluted 1/2) or a 1:1 dilution with an increase to 425mM NaCl (diluted 1/2 + NaCl)
