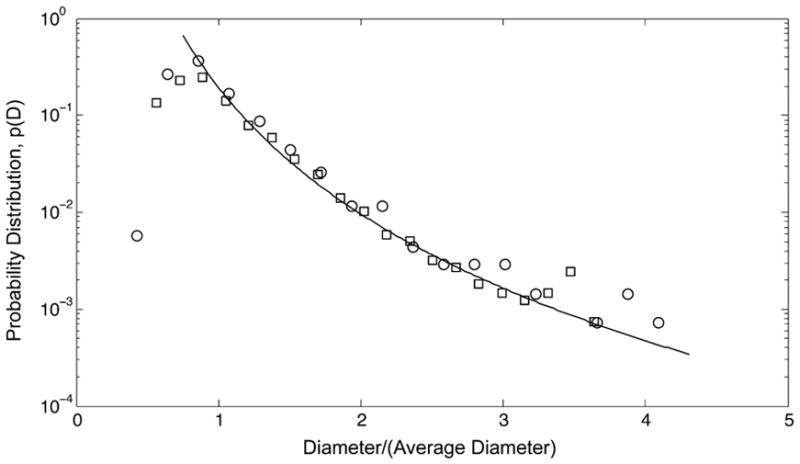
Figure 2.

Probability distribution, p(D), of vesicle diameters from cryo-TEM images (circles) and independently from A4F/MALS measurements (squares) for exosomes released from untreated TPC1 thyroid cancer cells16 plotted as a function of reduced diameter, D/〈D〉, where 〈D〉 = 46.6 nm (cryo-TEM, n = 1387) and 〈D〉 = 61.9 nm (A4F/MALS). The line corresponding to the extended tail of the distributions is provided to guide the eye.
