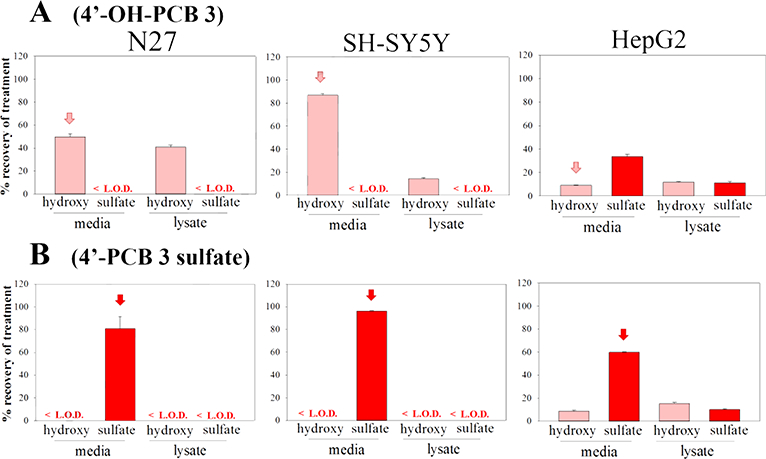
Fig. 2.

The distribution of: A) 4’-OH-PCB 3 and B) 4’-PCB 3 sulfate, in N27, SH-SY5Y, and HepG2 cells as determined by HPLC analysis. Cells were treated with 25 μM (2.5nmol) compound for 24h, then extracellular media and intracellular contents were collected and analyzed. The treatment compound is annotated with an arrow. The values shown are the means ± SE, n=3.
